
- Title
-
Genomic and Transcriptional Profiles of Kelch-like (klhl) Gene Family in Polyploid Carassius Complex
- Authors
- Peng, F., Zhou, L., Lu, W., Gan, R., Lu, M., Li, Z., Zhang, X., Wang, Y., Gui, J.
- Source
- Full text @ Int. J. Mol. Sci.
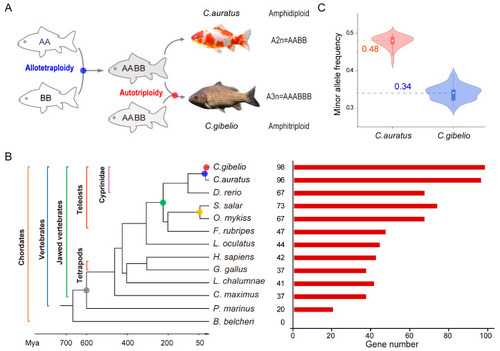
klhl gene families and polyploidy events in Carassius complex and other 11 animals. (A) Two polyploidy events occurred during Carassius evolution. (B) Number of klhl genes identified from the amphihaploid genomes of Carassius complex and other 11 animals. Grey, green, yellow, blue, and red cycles indicate the 1R/2R, Ts3R, salmon autotetraploidy, Cyprininae allotetraploidy, and Carassius autotriploidy events, respectively. (C) Violin plot for minor allele frequency of SNP sites in Carassius klhl genes. The line in the middle of each boxplot represents the median of the dataset. |
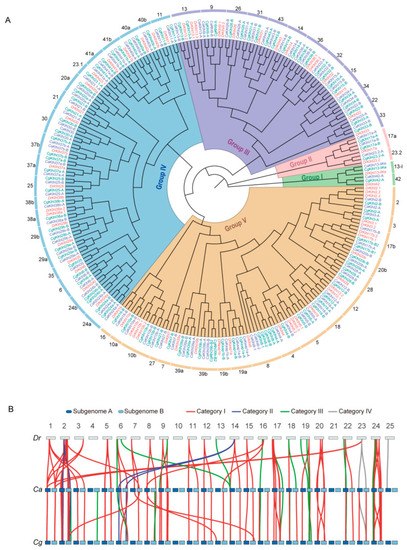
Phylogenetic and syntenic analyses of klhl gene families. (A) ML phylogenetic tree containing all Klhl members of D. rerio (Dr), C. auratus (Ca), and C. gibelio (Cg). (B) Synteny of klhl genes among D. rerio (Dr), C. auratus (Ca), and C. gibelio (Cg). Orthologous genes were classed into four categories and linked by different color lines. |
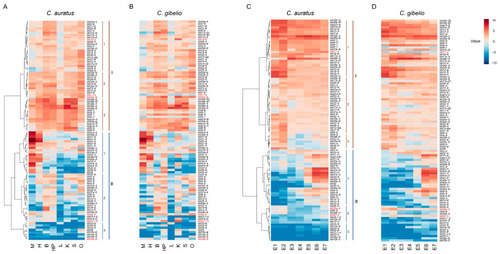
Heatmaps depicting Carassius klhl gene expression across eight adult tissues (A,B) and seven embryogenesis stages (C,D). The expression abundances were normalized by taking log2 of RPKM values, and the main hierarchical clusters were lined out on the left. M, Muscle; H, Heart; B, Brain; HP; Hypothalamus-pituitary; L, Liver; K, Kidney; S, Spleen; O, Ovary; E1, 4-cell stage; E2, Blastula stage; E3, Shield stage; E4, Bud stage; E5, 8-somite stage; E6, Prime-5 stage; E7, Pec-fin stage. Genes showing different expression patterns between C. auratus and C. gibelio are marked with red. For alignment, the missing genes are replaced by the homologous copies and indicated by asterisk. |
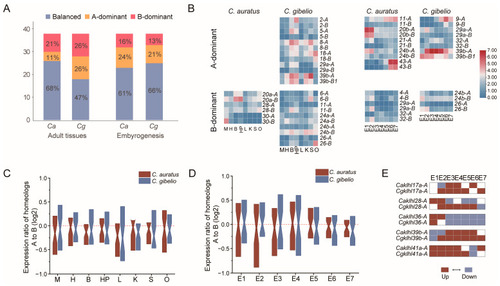
Expression divergence of klhl homeolog pairs in Carassius complex. (A) Combined analysis of gene expression showing balanced, homeolog A-dominant and homeolog B-dominant expression patterns for C. auratus (Ca) and C. gibelio (Cg). (B) Heatmaps of species-specific homeolog-dominant genes in the combined analyses for adult tissues and embryogenesis stages. (C,D) Expression ratio of homeolog A/B genes in the adult tissues (C) and the embryos at different developmental stages (D) of Carassius complex, zoomed in to show medians. M, Muscle; H, Heart; B, Brain; HP; Hypothalamus-pituitary; L, Liver; K, Kidney; S, Spleen; O, Ovary; E1, 4-cell stage; E2, Blastula stage; E3, Shield stage; E4, Bud stage; E5, 8-somite stage; E6, Prime-5 stage; E7, Pec-fin stage. (E) Expression trend of homeolog pairs with an expression-biased shift during embryogenesis. Ratio of A/B expression (Log2) is used for heatmap. Red tile (>0.1) represents A-dominant, while blue tile (<−0.1) represents B-dominant. |
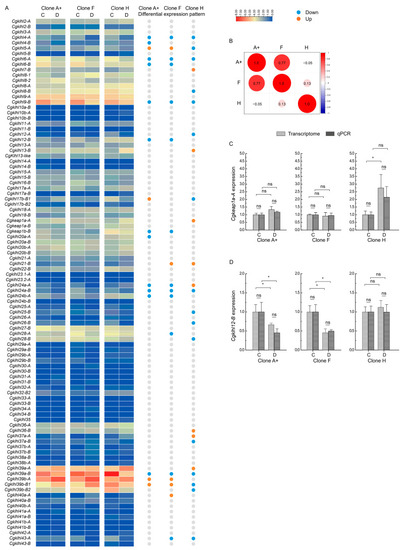
Expression of klhl genes in response to herpesvirus infection. (A) Heatmaps depicting expression of klhl genes in three C. gibelio clones before and after CaHV-2 infection. Differentially expressed genes with upregulated and downregulated expression levels after CaHV-2 infection are indicated by red and blue circles, respectively. C: Head–kidney tissues from healthy fishes. D: Head–kidney tissues from infected fishes. (B) Pearson correlation coefficients (r) for expression changes of DEGs among three clones. (C,D) Expression verification of keap1a-A (C) and klhl12-B (D) by qPCR. Data are presented by mean ± sd. ns.: no significance; * p < 0.05. |
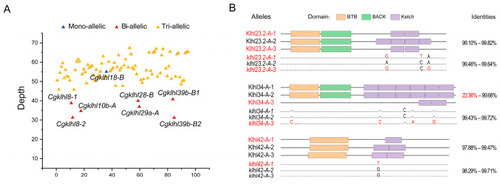
klhl alleles of C. gibelio. (A) Read depths of Cgklhl genes with different allele numbers. (B) Different nucleotide sequences and protein domain structures of the alleles. Nucleotide sequence and amino acid identities are shown on the right. Single nucleotide polymorphisms and indels affecting domain structure are presented and marked in red. |

Allele-specific expression of C. gibelio klhl genes. Ternary plots showing relative expression of allelic triads in the adult tissues and the embryos at different developmental stages (A). Each dot represents an allelic triad with the coordinates determined by relative contribution of each allele to the total expression (an example is shown on the top left). (B) Proportion of triads in each category across the 15 samples. (C) Variation of triad expression patterns. Ternary plot shows an example for measuring the variation of triad expression (left). Box plots show the distance between the triad position of the individual samples and the global average position in each category in (A). The line in the middle of each boxplot represents the median of the dataset; the upper and lower edges of the boxplot indicate the third quartile and the first quartile, respectively; and the line extending from the edge is 1.5 times the interquartile range. Small dots indicate outliers. “*” indicates a p-value < 0.005. (D) Expression pattern of dominant allele for every sample across the 15 samples. |