
Figure 4
- ID
- ZDB-FIG-230515-69
- Publication
- Peng et al., 2023 - Genomic and Transcriptional Profiles of Kelch-like (klhl) Gene Family in Polyploid Carassius Complex
- Other Figures
- All Figure Page
- Back to All Figure Page
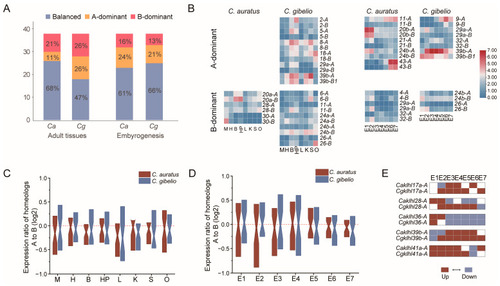
Expression divergence of klhl homeolog pairs in Carassius complex. (A) Combined analysis of gene expression showing balanced, homeolog A-dominant and homeolog B-dominant expression patterns for C. auratus (Ca) and C. gibelio (Cg). (B) Heatmaps of species-specific homeolog-dominant genes in the combined analyses for adult tissues and embryogenesis stages. (C,D) Expression ratio of homeolog A/B genes in the adult tissues (C) and the embryos at different developmental stages (D) of Carassius complex, zoomed in to show medians. M, Muscle; H, Heart; B, Brain; HP; Hypothalamus-pituitary; L, Liver; K, Kidney; S, Spleen; O, Ovary; E1, 4-cell stage; E2, Blastula stage; E3, Shield stage; E4, Bud stage; E5, 8-somite stage; E6, Prime-5 stage; E7, Pec-fin stage. (E) Expression trend of homeolog pairs with an expression-biased shift during embryogenesis. Ratio of A/B expression (Log2) is used for heatmap. Red tile (>0.1) represents A-dominant, while blue tile (<−0.1) represents B-dominant. |