
|
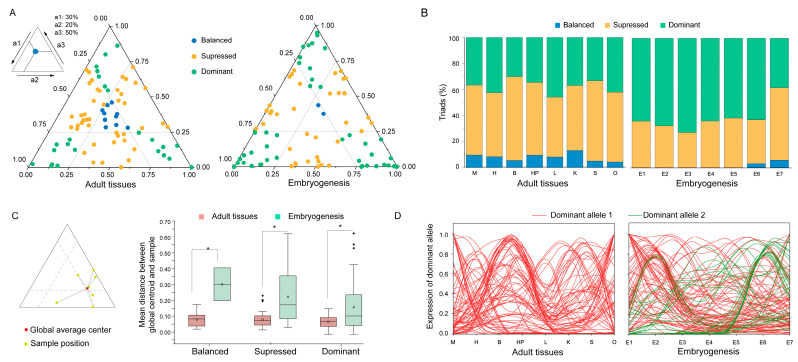
Figure 7
Allele-specific expression of C. gibelio klhl genes. Ternary plots showing relative expression of allelic triads in the adult tissues and the embryos at different developmental stages (A). Each dot represents an allelic triad with the coordinates determined by relative contribution of each allele to the total expression (an example is shown on the top left). (B) Proportion of triads in each category across the 15 samples. (C) Variation of triad expression patterns. Ternary plot shows an example for measuring the variation of triad expression (left). Box plots show the distance between the triad position of the individual samples and the global average position in each category in (A). The line in the middle of each boxplot represents the median of the dataset; the upper and lower edges of the boxplot indicate the third quartile and the first quartile, respectively; and the line extending from the edge is 1.5 times the interquartile range. Small dots indicate outliers. “*” indicates a p-value < 0.005. (D) Expression pattern of dominant allele for every sample across the 15 samples.