
Figure 3
- ID
- ZDB-FIG-230515-68
- Publication
- Peng et al., 2023 - Genomic and Transcriptional Profiles of Kelch-like (klhl) Gene Family in Polyploid Carassius Complex
- Other Figures
- All Figure Page
- Back to All Figure Page
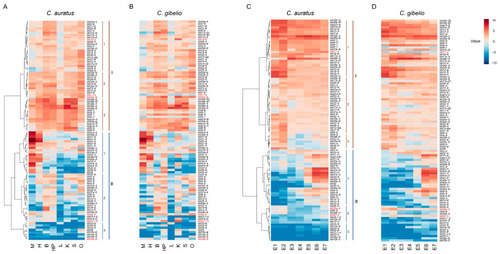
Heatmaps depicting Carassius klhl gene expression across eight adult tissues (A,B) and seven embryogenesis stages (C,D). The expression abundances were normalized by taking log2 of RPKM values, and the main hierarchical clusters were lined out on the left. M, Muscle; H, Heart; B, Brain; HP; Hypothalamus-pituitary; L, Liver; K, Kidney; S, Spleen; O, Ovary; E1, 4-cell stage; E2, Blastula stage; E3, Shield stage; E4, Bud stage; E5, 8-somite stage; E6, Prime-5 stage; E7, Pec-fin stage. Genes showing different expression patterns between C. auratus and C. gibelio are marked with red. For alignment, the missing genes are replaced by the homologous copies and indicated by asterisk. |