
- Title
-
Temporal and clonal characterization of neural stem cell niche recruitment in the medaka neuromast
- Authors
- Onistschenko, J., Kaminsky, S., Vazquez-Marín, J., Gross, K., Wang, T., Seleit, A., Dörr, M., Centanin, L.
- Source
- Full text @ Cells Dev
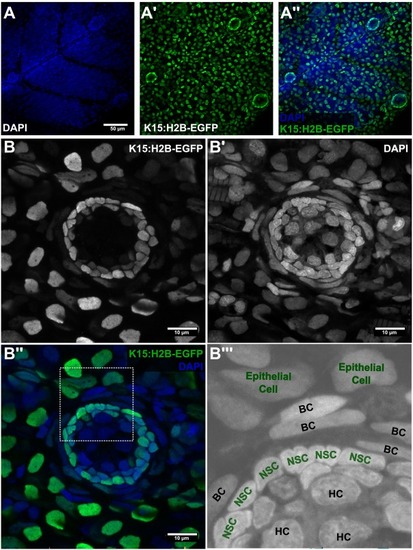
The stem cell niche in mature medaka neuromasts. (A) Low resolution confocal images of medaka juveniles - 10dpf. Neuromasts are recognised by DAPI stn (A) and by H2B-EGFP expression in Tg(K15:H2B-EGFP) (A’, A”). (B) High magnification view of a medaka mature neuromasts. The Tg(K15:H2B-EGFP) allows for visualization of epithelial cells (rounded nuclei in B, periphery; B”’) and neuromast stem cells (central, packed cells in B). Counterstain with DAPI reveals border cells (B’-B”’) with elongated nuclei wrapping the EGFP+ stem cells (NSCs) in the neuromast (B”-B”’). HC in B”’ indicates neuronal hair cells. Scale bar is 50 μm in A and 10 μm in B. |
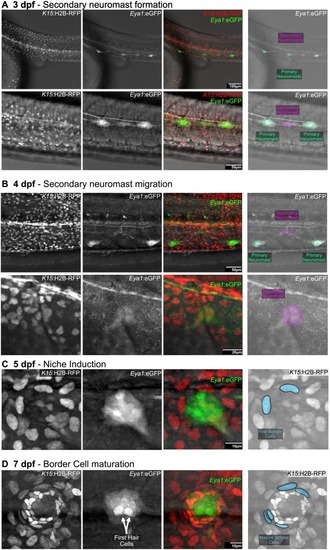
Induction of the stem cell niche in secondary neuromasts. Confocal imaging of double Tg(Eya1:eGFP)(K15:H2B-RFP) during secondary neuromast formation. (A) The forming secondary neuromast can be detected between two primary EGFP+ organs. (B) Primary neuromasts move to the ventral side while forming secondary organs migrate dorsally. (C) First epithelial cells transforming into border cells are detected in the neuromast periphery by 5dfp. (D) The neuromast has established its characteristic architecture and is surrounded by several mature border cells discernible by their elongated nuclei. |
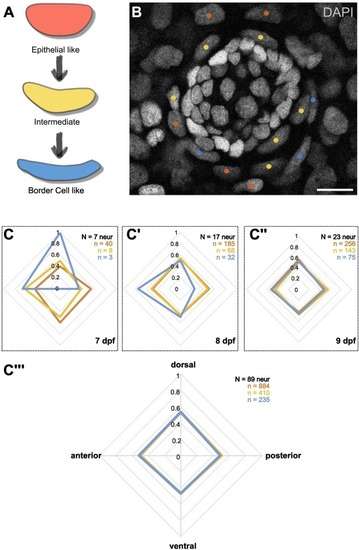
Directionality of border cell recruitment. (A) Schematic overview of the morphological changes of nuclei during epithelial to border cell transformation. (B) Exemplary image of a neuromast from a medaka hatchling 9 dpf. Nuclei are counterstained with DAPI. Different transformation stages of the surrounding cells are indicated by color. (C) Quantification of recruited-cells' initial position. First border cells are found at the dorsal-anterior side of the organ (C) and soon after are equally distributed (C’-C”). Analysis of neuromasts of all investigated time points and positions together shows no bias for any transformational stage (C”’). Scale bar is 10 μm. |

Multiclonal recruitment of border cells in medaka. (A) Confocal live image of a GaudiLoxPOUT medaka juvenile at 10 dfp (A). Border cells are typically in close proximity to 2–3 neural stem cells (A’). (B) Confocal image of a GaudiBBW2.1 GaudiK15:LexPR OP:CRE recombined juvenile showing EGFP+ and EGFP− border cells. (C) Confocal live image of a GaudiNSG GaudiK15:LexPR OP:CRE recombined, Tg(K15:H2B-RFP) medaka juvenile at 10 dfp. There are EGFP+ and EGFP− cells among the K15+ border cells. Scale bar is 10 μm. |
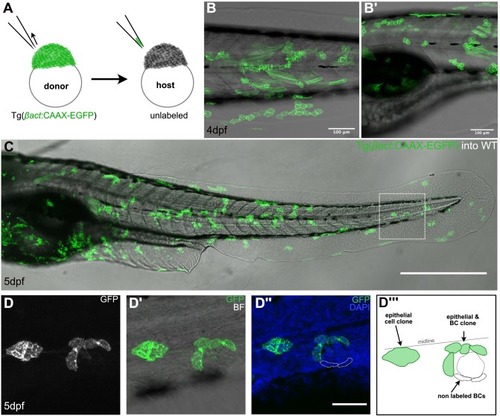
Multiclonal recruitment of border cells in zebrafish. (A) Schematic representation of blastula transplantation in zebrafish, taking a few cells from the donor Tg(βact:CAAX-EGFP) into an unlabeled wildtype host. (B-B´) Live images of 4 dpf chimeric zebrafish larvae, with EGFP+ clones along the body. (C) Fixed chimeric zebrafish larva at 5dpf showing EGFP+ clones that include epithelial/border cells. (D) Zoom-in of the chimeric zebrafish larva (squared in C). The clone including epithelial and border cells (D, D’) does not cover the entire niche compartment of the neuromast (D”) as depicted in the schematic representation (D”’). Scale bar is 100 μm in B, B’, 500 μm in C and 50 μm in D-D”. |
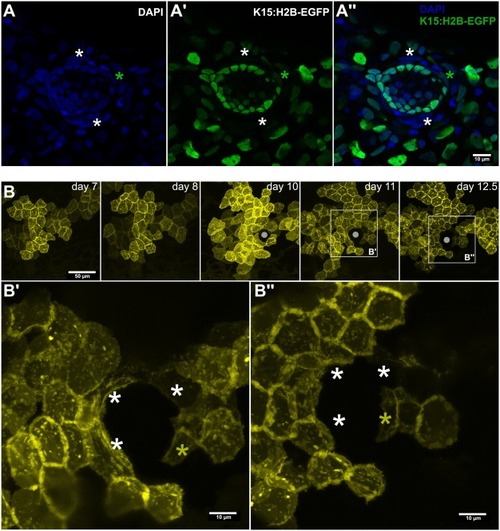
Sequential recruitment of niche cells during neuromast formation. (A) Confocal image of a Tg(K15:H2-EGFP) 10dfp larva counterstained with DAPI. White asterisks indicate EGFP− border cells, green asterisk indicates an EGFP+ border cell. (B) Time-lapse imaging of the same clone on a medaka embryo injected with the K15:mYFP construct. Gray circle in B indicates the position of the forming neuromast, white asterisks in B’, B” indicate border cells already converted where YFP signal decreases between 11 and 12.5 dpf, yellow asterisk in B’, B” indicates a newly recruited border cell during the same time frame. Scale bar is 10 μm in A-A”, B’, B” and 50 μm in B. |
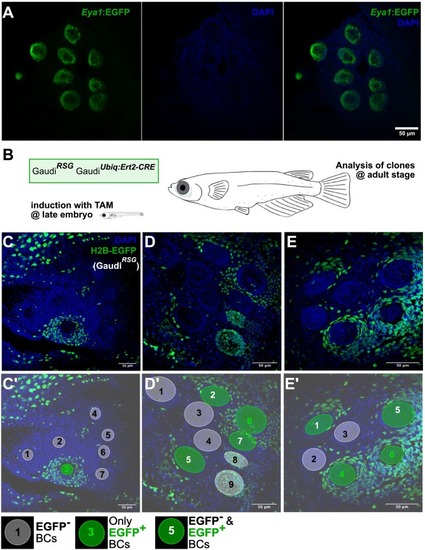
Niche expansion during post-embryonic life. (A) Confocal image of a Tg(Eya1:EGFP) adult medaka fish counterstained with DAPI, displaying 9 neuromasts arranged in the so-called caudal neuromast cluster. (B) Clone-induction strategy. Fish were treated with tamoxifen during late embryonic stage and imaged at adult stage. (C-E’) Examples of caudal neuromast clusters of recombined Gaudi fish. Clones over the border cell compartment are big and typically cover an entire neuromast (C), neighbor neuromasts (E) or a continuous, big portion of a neuromast (D). C’, D’, E’ are annotated versions of C, D, E and indicate EGFP+, EGFP− and hybrid niche compartments. Scale bar is 50 μm. |
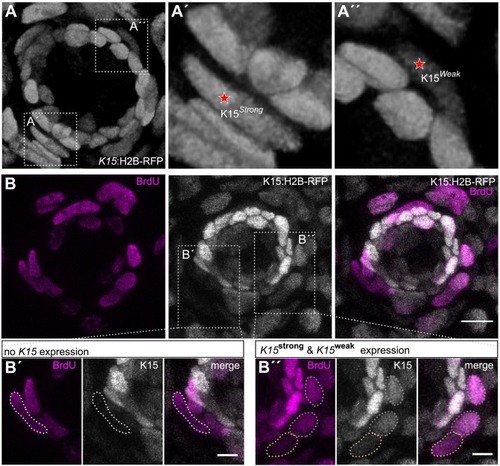
Proliferation of niche cells via BrdU staining. (A) 3D reconstruction of a neuromast from a living Tg(K15:H2B-RFP) juvenile indicating the different intensities of K15+ border cells. Dotted boxes display the zoom-ins for a strong (A’) and a weak (A”) K15+ border cell indicated with a star. (B) Z-projection of a confocal stack, displaying a neuromast from a Tg(K15:H2B-RFP) juvenile which was treated with a 6 h BrdU pulse. BrdU+ cells are displayed in magenta and K15+ cells in gray. Dotted boxes indicate the area of strong, weak, and non expressing K15 border cells, which are depicted in higher magnification in B’, B”. Scale bar indicates 10 μm in B and 5 μm in B’, B”. |

Time lapse imaging of BC proliferation in zebrafish. Confocal time series of a Tg(K15:H2B-EGFP) zebrafish embryo at 2dpf. (A) Left panel shows a newly formed neuromast with already 4 recruited BCs with different K15 expression intensities. The K15weak BC1 starts to divide at 04:00, indicated with a red star. At 05:00, BC1 has divided and BC1a and BC1b are surrounding the lower part of the neuromast. (B) A newly formed neuromast has three BCs which will sequentially divide over the next 12 h. By the end, the neuromast is surrounded by six BCs. Dividing cells are indicated by a red star. Scale bar is 10 μm. |