
Fig. 8
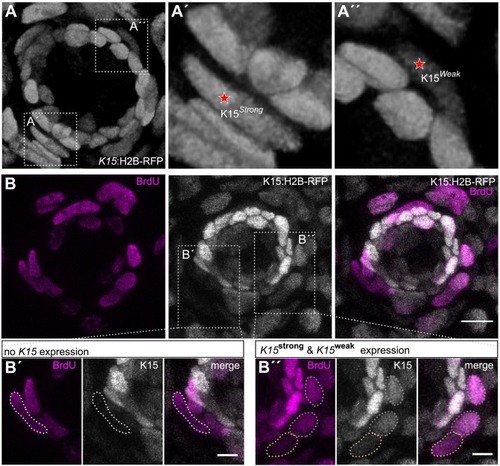
Proliferation of niche cells via BrdU staining. (A) 3D reconstruction of a neuromast from a living Tg(K15:H2B-RFP) juvenile indicating the different intensities of K15+ border cells. Dotted boxes display the zoom-ins for a strong (A’) and a weak (A”) K15+ border cell indicated with a star. (B) Z-projection of a confocal stack, displaying a neuromast from a Tg(K15:H2B-RFP) juvenile which was treated with a 6 h BrdU pulse. BrdU+ cells are displayed in magenta and K15+ cells in gray. Dotted boxes indicate the area of strong, weak, and non expressing K15 border cells, which are depicted in higher magnification in B’, B”. Scale bar indicates 10 μm in B and 5 μm in B’, B”. |