
|
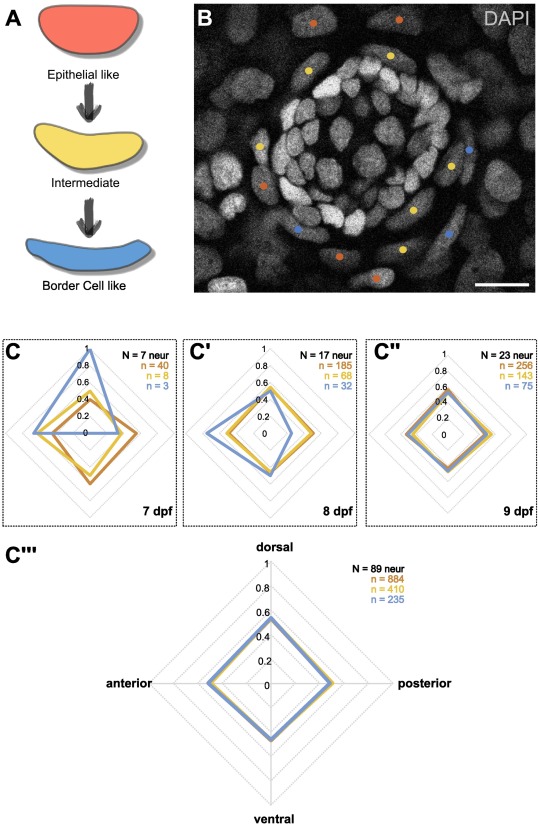
Fig. 3 Directionality of border cell recruitment.
(A) Schematic overview of the morphological changes of nuclei during epithelial to border cell transformation. (B) Exemplary image of a neuromast from a medaka hatchling 9 dpf. Nuclei are counterstained with DAPI. Different transformation stages of the surrounding cells are indicated by color. (C) Quantification of recruited-cells' initial position. First border cells are found at the dorsal-anterior side of the organ (C) and soon after are equally distributed (C’-C”). Analysis of neuromasts of all investigated time points and positions together shows no bias for any transformational stage (C”’). Scale bar is 10 μm.