
- Title
-
Common features of cartilage maturation are not conserved in an amphibian model
- Authors
- Nguyen, J.K.B., Gómez-Picos, P., Liu, Y., Ovens, K., Eames, B.F.
- Source
- Full text @ Dev. Dyn.
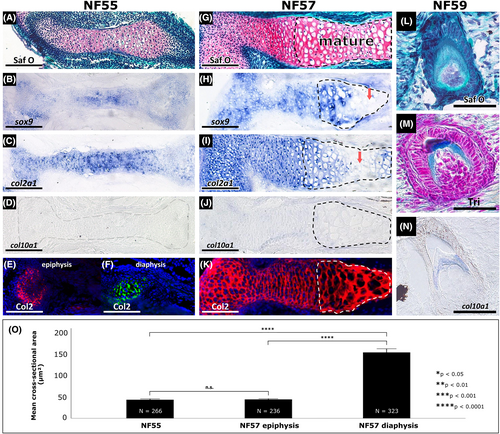
The Xenopus tropicalis humerus mostly followed the standard process of cartilage maturation. (A,G) Compared to the NF55 humerus (A), Safranin O staining of the NF57 humerus (G) showed that mature chondrocytes (dashed black lines) in the diaphysis had become overtly hypertrophic. (B,H) Compared to the NF55 humerus (B), sox9 expression was eventually down-regulated in mature chondrocytes of the NF57 humerus (H, red arrow). (C,I) Similarly, col2a1 was down-regulated in mature chondrocytes of the NF57 humerus (I, red arrow), compared to the NF55 humerus (C). (D,J) Expression of col10a1 was undetectable in the humerus at both NF55 (D, translucent dashes outline the humerus) and even in hypertrophic chondrocytes at NF57 (J, dashed black lines). (E,F,K) Immunostaining showed expression of Col2 protein in cross-sections of the epiphysis (E, red) and diaphysis (F, green) of the NF55 humerus and immature and mature cartilage of the NF57 humerus (K). (L-N) Histological staining of an NF59 tooth with Safranin O (L) and Trichrome (M) helps to identify col10a1 expression in odontoblasts and dentin ECM (N), which has properties similar to osteoid found in bone.103 (O) Cross-sectional areas of chondrocytes from NF55 and NF57 humeri quantitating the increase in cell size (hypertrophy) from immature to mature chondrocytes. Asterisks indicate significance at *P < 0.05, **P < 0.01, ***P < 0.001, and ****P < 0.0001 and error bars indicate a 95% confidence interval. Abbreviations: ECM, extracellular matrix; N, total number of cells measured from three biological replicates; Tri, Trichrome; Saf O, Safranin O. Scale bars = 100 μm for panels A to K; Scale bars = 50 μm for panels L to N |
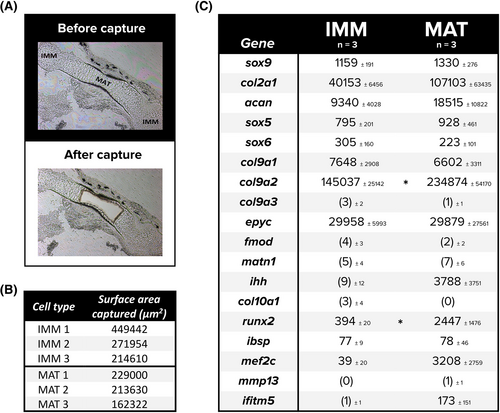
Analysis of standard cartilage markers from laser captured cells of the frog humerus suggest many genes associated with immature chondrocytes do not down-regulate as they mature. (A-C) Chondrocytes were laser captured from the frog humerus (A), targeting immature (not shown) and mature cartilage separately and in triplicate (B), from which RNA was isolated and the resulting sequencing data normalized to determine average normalized counts (and standard deviations) of major cartilage genes present in each cell type (C). Eleven early chondrogenic markers and seven hypertrophic markers are listed, where counts below threshold are in parentheses. An independent samples t-test was employed to determine any differences between counts of IMM and MAT. Asterisks indicate significance at *P < 0.05. Abbreviations: IMM, immature chondrocytes; MAT, mature chondrocytes; n, sample size |
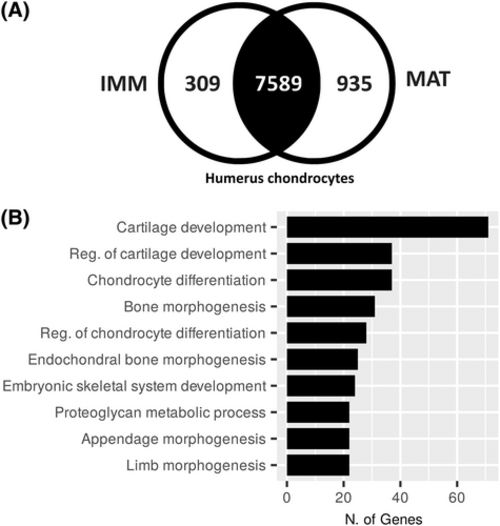
Enriched GO terms of cartilage genes shared between IMM and MAT. (A) A Venn diagram showing 8833 total genes expressed above threshold in both IMM and MAT of an NF57 humerus of frog, where 7589 are shared between IMM and MAT. (B) Of the 7589 overlapping genes, GO term analysis revealed at least 109 are known to be involved in biological processes related to cartilage formation. Abbreviations: GO, gene ontology; IMM, immature chondrocytes; MAT, mature chondrocytes |
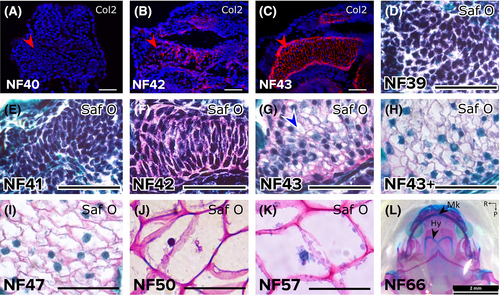
Sub-staging early ceratohyal development revealed chondrocyte differentiation and hypertrophy. (A-C) Immunostaining demonstrated that Col2 was not secreted by the ceratohyal condensation at NF40 (A), began to be detected in the NF42 ceratohyal (B), and was abundant in the NF43 ceratohyal (C). Red arrowheads point to lateral edge of one ceratohyal. (D-K) Safranin O staining showed the progression of ceratohyal development. Mesenchyme condensed from NF39 (D) to N41 (E), and strong Safranin O staining by NF42 (F) demonstrated overt chondrocyte differentiation. Chondrocyte hypertrophy was evident a few hours later in the NF43 ceratohyal (G, blue arrowhead) and was widespread slightly later (NF43+, H). Chondrocytes in the ceratohyal increased hypertrophy (became larger) from stages NF47 (I) to NF50 (J) to NF57 (K). (L) Alcian blue/Alizarin red whole-mount staining at NF66 after metamorphosis demonstrated that the ceratohyal persists as the hyale and does not ossify. Abbreviations: Col2, collagen type 2; Hy, hyale; Mk, Meckel's cartilage; Saf O, Safranin O. Scale bars = 50 μm |

Gene expression during ceratohyal hypertrophy did not follow the standard process of cartilage maturation. (A-C) Col2 immunostaining demonstrated that ceratohyal chondrocytes had secreted cartilage matrix at NF42 (A), had begun hypertrophy at NF43 (B), and remained hypertrophic at NF57 (C). (D-F) Levels of sox9 expression were similar as ceratohyal chondrocytes underwent hypertrophy from NF42 (D) to NF43 (E), but might have down-regulated a bit by NF57 (F). (G-I) Levels of col2a1 expression appeared similar in ceratohyal chondrocytes from NF42 (G) to NF43 (H) to NF57 (I). (J-L) The typical hypertrophic marker col10a1 was not expressed by ceratohyal chondrocytes at NF42 (J), NF43 (K), or NF57 (L). Dashed red lines in all images outline the developing ceratohyal. Abbreviation: Col2, collagen type 2. NF42 and NF43 scale bars = 50 μm; NF57 scale bars = 500 μm |
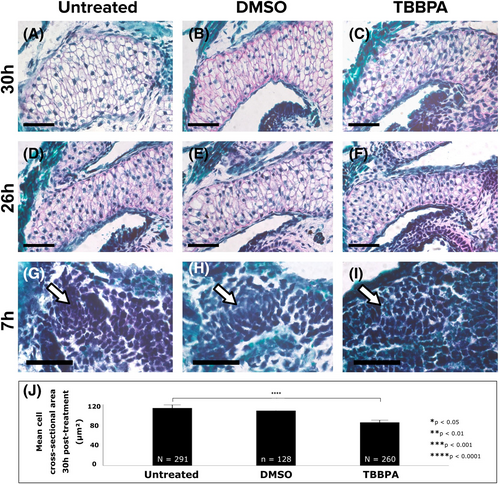
Ceratohyal hypertrophy and earlier mesenchymal condensation might have been delayed by the thyroid hormone antagonist TBBPA. (A-C) Safranin O staining revealed that ceratohyals of untreated (A), DMSO-treated (B), and TBBPA-treated (C) embryos had all undergone hypertrophy 30 hours after treatment. (D-F) Earlier, 26 hours after treatment, Safranin O staining suggested that ceratohyal chondrocytes of untreated (D) and DMSO-treated (E) were more hypertrophic than TBBPA-treated (F) embryos. (G-I, white arrows) Even earlier, Safranin O staining suggested that ceratohyals of untreated (G) and DMSO-treated (H) had undergone mesenchymal condensation 7 hours after treatment, but condensation of TBBPA-treated (I) mesenchyme appeared delayed. (J) Measurements of chondrocyte cross-sectional areas after 30 hours of treatment in untreated, DMSO-, and TBBPA-treated groups. Abbreviations: N, total number of cells measured from three biological replicates; n, number of cells from one sample. Asterisks indicate significance at *P < 0.05, **P < 0.01, ***P < 0.001, and ****P < 0.0001 and error bars indicate a 95% confidence interval. Scale bars = 50 μm. TBBPA, tetrabromobisphenol A |
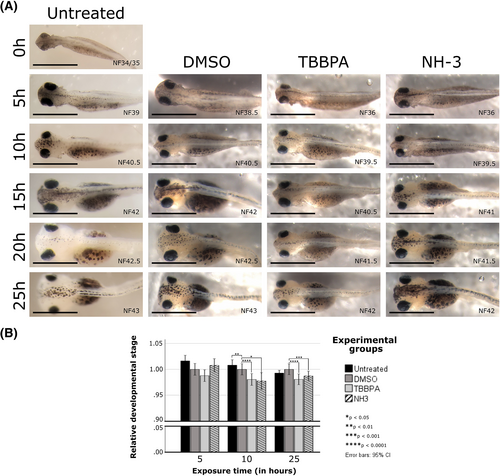
Inhibiting thyroid hormone signalling with TBBPA produced a global delay in development. (A) Gross images of representative larvae showed developmental delay over multiple timepoints (10 and 25 hours after treatment) for TBBPA- or NH-3-treated larvae, compared to untreated or DMSO-treated larvae. Although dorsal images are shown here to emphasize head size and shape, samples were correlated with and staged according to external criteria from the ventral and side profiles as well (e.g., number of intestinal coils, angle of proctodeum, etc). (B) Independent samples t-tests demonstrated that both TBBPA-treated and NH-3-treated larvae showed significantly delayed morphological developmental staging features, compared to untreated or DMSO-treated larvae. NH-3 data were from a single trial only. Asterisks indicate significance at *P < 0.05, **P < 0.01, ***P < 0.001, and ****P < 0.0001. TBBPA, tetrabromobisphenol A |