
|
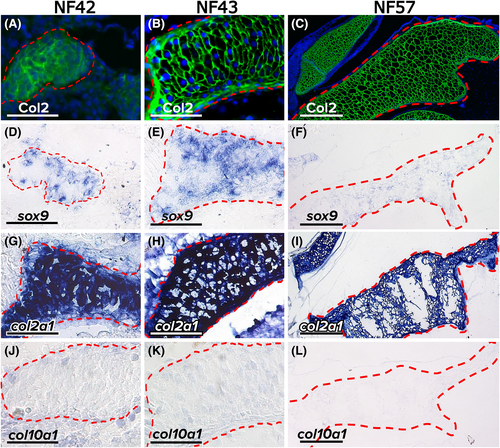
Fig. 5 Gene expression during ceratohyal hypertrophy did not follow the standard process of cartilage maturation. (A-C) Col2 immunostaining demonstrated that ceratohyal chondrocytes had secreted cartilage matrix at NF42 (A), had begun hypertrophy at NF43 (B), and remained hypertrophic at NF57 (C). (D-F) Levels of sox9 expression were similar as ceratohyal chondrocytes underwent hypertrophy from NF42 (D) to NF43 (E), but might have down-regulated a bit by NF57 (F). (G-I) Levels of col2a1 expression appeared similar in ceratohyal chondrocytes from NF42 (G) to NF43 (H) to NF57 (I). (J-L) The typical hypertrophic marker col10a1 was not expressed by ceratohyal chondrocytes at NF42 (J), NF43 (K), or NF57 (L). Dashed red lines in all images outline the developing ceratohyal. Abbreviation: Col2, collagen type 2. NF42 and NF43 scale bars = 50 μm; NF57 scale bars = 500 μm