
Fig. 2
- ID
- ZDB-FIG-240202-40
- Publication
- Nguyen et al., 2023 - Common features of cartilage maturation are not conserved in an amphibian model
- Other Figures
- All Figure Page
- Back to All Figure Page
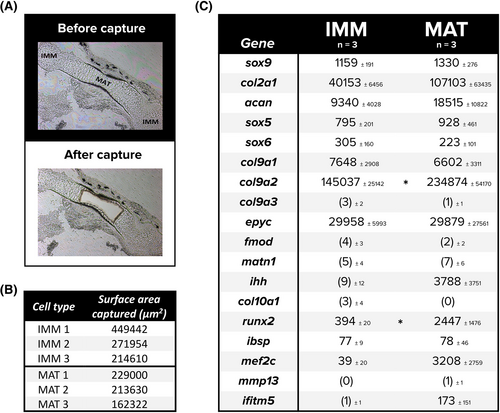
Analysis of standard cartilage markers from laser captured cells of the frog humerus suggest many genes associated with immature chondrocytes do not down-regulate as they mature. (A-C) Chondrocytes were laser captured from the frog humerus (A), targeting immature (not shown) and mature cartilage separately and in triplicate (B), from which RNA was isolated and the resulting sequencing data normalized to determine average normalized counts (and standard deviations) of major cartilage genes present in each cell type (C). Eleven early chondrogenic markers and seven hypertrophic markers are listed, where counts below threshold are in parentheses. An independent samples t-test was employed to determine any differences between counts of IMM and MAT. Asterisks indicate significance at *P < 0.05. Abbreviations: IMM, immature chondrocytes; MAT, mature chondrocytes; n, sample size |