
- Title
-
The non-canonical Wnt receptor Ror2 is required for cartilage cell polarity and morphogenesis of the craniofacial skeleton in zebrafish
- Authors
- Dranow, D.B., Le Pabic, P., Schilling, T.F.
- Source
- Full text @ Development
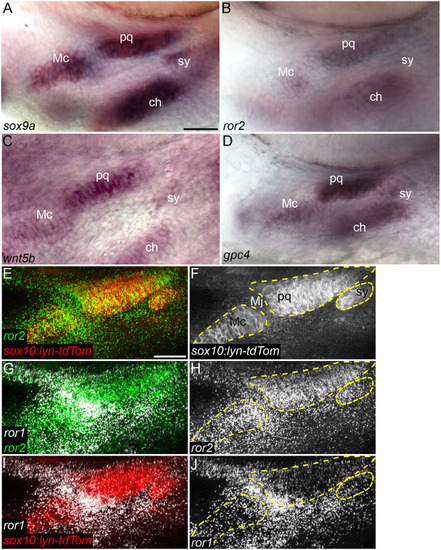
Wnt cell polarity pathway genes are expressed in cartilage progenitors. (A-D) In situ hybridization for sox9a (A), ror2 (B), wnt5b (C) and gpc4 (D) in 54 hpf wild-type (WT) embryos. Ventrolateral views of the mandibular and hyoid arches below the eye. (E-J) HCR for ror1 and ror2 in a 55 hpf WT Tg(sox10-lyn-tdTomato) (sox10:lyn-tdTom) embryo. ror1 in white, ror2 in green and sox10:lyn-tdTom in red (E,G,I). Grayscale (F,H,J). Panels E-J are z-projections. ch, ceratohyal cartilage; Mc, Meckel's cartilage; Mj, Meckel's joint; pq, palatoquadrate cartilage; sy, symplectic cartilage. Mc, pq and sy cartilages are outlined in dashed yellow line. Anterior to the left in all panels. Scale bars: 25 μm. |
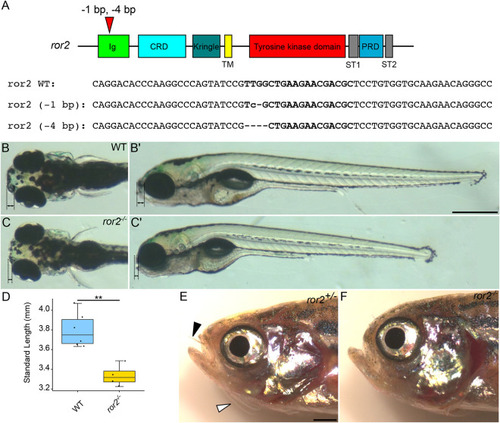
ror2 mutants have craniofacial abnormalities and defects associated with disrupted cell polarity. (A) Diagram of zebrafish ror2 gene with domains annotated. Red triangle indicates gRNA target sites and the two alleles recovered. Bold text indicates gRNA target sites in the selected genomic DNA sequences. (B-C′) Representative images of 5 dpf wild type (WT) (B,B′) and MZ-ror2 (C,C′) mutants. Dorsal (B,C) and lateral (B′,C′) views. Black dotted lines with double arrows indicate tissue anterior to the eyes. (D) Box plot comparing standard lengths of WT (n=6) and ror2−/− (n=4) embryos at 5 dpf. **P<0.01 (Wilcoxon rank-sum test). Box plot shows the median (middle bar) and first to third interquartile ranges (boxes); whiskers indicate 1.5× the interquartile ranges; dots indicate data points. (E,F) Phenotypically WT ror2+/− (E) and ror2−/− (F) adults. Black arrowhead indicates nasal barbel and white arrowhead indicates maxillary barbel. Ig, immunoglobulin-like domain; CRD, cysteine-rich domain; Kringle, Kringle domain; TM, transmembrane domain; ST1, serine-threonine domain 1; ST2, serine-threonine domain 2; PRD, proline-rich domain. Scale bars: 500 µm for B-C′; 1 mm for E,F. |
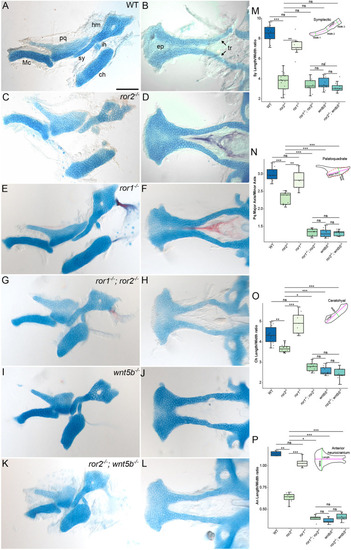
Cartilage phenotypes in ror1 and ror2 mutants. (A-L) Alcian Blue-Alizarin Red staining of craniofacial cartilages at 5 dpf. Lateral views of the upper and lower jaw cartilages (A,C,E,G,I,K) and cartilages of the anterior neurocranium (B,D,F,H,J,L). Representative images of cartilages from wild-type (WT; A,B), ror2−/− (C,D), ror1−/− (E,F), ror1−/−; ror2−/− (G,H), wnt5b−/− (I,J) and ror2−/−; wnt5b−/− (K,L) animals. Arrows point to trabecular cartilages. Anterior is to the left for all panels. (M-P) Quantifications of measured ratios: sy length-to-width (M); pq major axis-to-minor axis (N); ch length-to-width (O); An length-to-width (P). Diagrams of the sy cartilage, pq cartilage, ch cartilage and An indicating measured features are inset in panels M-P. n=10 WT, 9 ror1−/−, 18 ror2−/−, 10 ror1−/−; ror2−/−, 10 wnt5b−/− and 12 ror2−/−; wnt5b−/− sy cartilages for M. n=9 WT, 9 ror1−/−, 18 ror2−/−, 10 ror1−/−; ror2−/−, 10 wnt5b−/− and 12 ror2−/−; wnt5b−/− pq cartilages for N. n=10 WT, 9 ror1−/−, 18 ror2−/−, 10 ror1−/−; ror2−/−, 10 wnt5b−/− and 12 ror2−/−; wnt5b−/− ch cartilages for O. n=4 WT, 5 ror1−/−, 9 ror2−/−, 4 ror1−/−; ror2−/−, 5 wnt5b−/− and 6 ror2−/−; wnt5b−/− An for P. *P<0.05; **P<0.01; ***P<0.001 (Kruskal–Wallis test with post-hoc Dunn's test and Bonferroni correction). ns, not significant. Box plots show median (middle bar) and first to third interquartile ranges (boxes); whiskers indicate 1.5× the interquartile ranges; dots indicate data points. An, anterior neurocranium; ch, ceratohyal cartilage; ep, ethmoid plate; hm, hyomandibular cartilage; ih, interhyal cartilage; Mc, Meckel's cartilage; pq, palatoquadrate cartilage; sy, symplectic cartilage; tr, trabecular cartilage. Scale bar: 100 μm for A-L. |
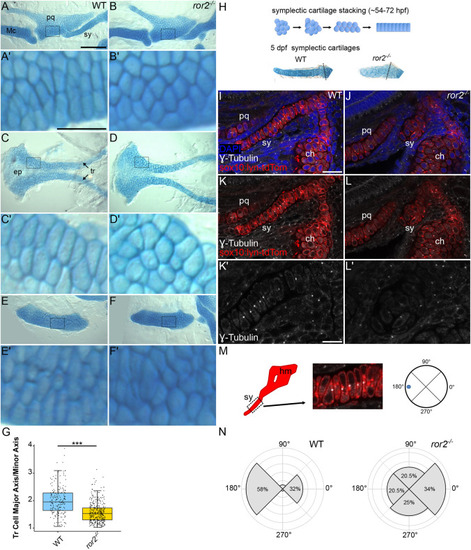
Cell polarity is disrupted in ror2 mutants. (A-F′) Wild type (WT) and ror2−/− cartilages showing Palatoquadrate cartilages (A-B′), anterior neurocrania (C-D′) and ceratohyal cartilages (E-F′). Panels A′, B′, C′, D′, E′ and F′ are magnified views of the boxed regions in panels A, B, C, D, E and F, respectively. Arrows point to trabecular cartilages. (G) Quantifications of trabecular cell major axis-to-minor axis. ***P<0.001 (Wilcoxon rank-sum test). Box plot shows the median (middle bar) and first to third interquartile ranges (boxes); whiskers indicate 1.5× the interquartile ranges; dots indicate data points. n=195 WT and 379 ror2−/− tr cells. (H) Diagram of symplectic cartilage stacking and representative examples of 5 dpf Alcian Blue-stained symplectic cartilages. (I-N) Cell polarity measurements. Representative WT (I,K) and ror2−/− (J,L) sox10:lyn-tdTomato transgenic craniofacial cartilages stained with anti-γ-tubulin antibody in white. Panels I-L′ are a single slice of a z-stack. DAPI in blue, anti-γ-tubulin in white and sox10:lyn-tdTomato in red for I-L′. Panels K′ and L′ are magnified views of symplectic cartilages in K and L, respectively. (M) Diagram of how polarity was determined in symplectic cartilages. (N) Quantification of the distribution of the microtubule-organizing center (MTOC) in WT and ror2−/− symplectic cartilage cells. P<0.001 (Watson's two-sample test for homogeneity). ch, ceratohyal cartilage; ep, ethmoid plate; hm, hyomandibula; Mc, Meckel's cartilage; pq, palatoquadrate cartilage; sy, symplectic cartilage; tr, trabecular cartilage. Scale bars: 100 μm for A,B,C,D,E,F; 25 μm for A′,B′,C′,D′,E′,F′; 20 μm for I-L; 10 μm for K′,L′. |
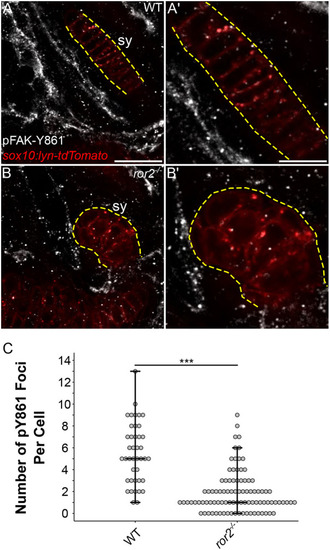
ror2 chondrocytes have a reduced number of focal adhesions. (A-B′) pFAK staining. Representative symplectic cartilages in WT (A) and ror2−/− (B) sox10:lyn-tdTomato transgenic fish at 3 dpf stained with anti-phospho-tyrosine 861 focal adhesion kinase antibody (pFAK-Y861) in white. Magnified views of symplectic cartilages in A′ and B′, respectively. Sox10:lyn-tdTomato chondrocytes in red. Panels A and B are a single slice of a z-stack. Dashed yellow lines delineate the symplectic cartilage visible in the selected slice. (C) Quantification of the number of pY861 foci per cell. Each point represents a single cell. Maximum, minimum and median values are depicted as crossbars on the dot plot. Sy, symplectic cartilage. ***P<0.001 (Wilcoxon rank-sum test). Scale bars: 20 μm for A and B; 10 μm for A′ and B′. |
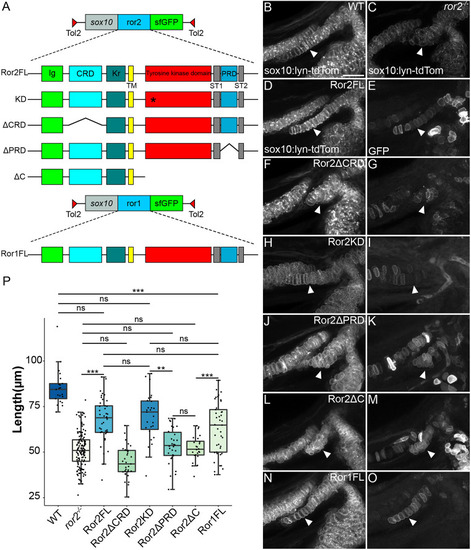
Ror2 domain analysis reveals differential requirements for cartilage stacking. (A) Schematic of ror2 transgenic constructs. A sox10 enhancer element drives expression of Ror2-SuperFolderGFP (sfGFP) fusions in a Tol2 vector. Constructs include full-length Ror2-sfGFP (Ror2FL), Ror2K509R-sfGFP (KD), Ror2ΔCRD-sfGFP (ΔCRD), Ror2ΔPRD-sfGFP (ΔPRD), Ror2ΔC-sfGFP (ΔC) and full-length Ror1 (Ror1FL). Asterisk indicates the location of the K509R mutation. (B,C) Confocal images of fluorescent cartilages at 3 dpf in WT (B) and ror2−/− (C) in a Tg(sox10:lyn-tdTomato) background. (D-O) Representative rescue construct mosaic transgenic cartilages in grayscale showing sox10:lyn-tdTomato only (D,F,H,J,L,N) or GFP only (E,G,I,K,M,O). White arrowheads indicate the symplectic cartilage. Panels B-O are z-projections. (P) Quantification of symplectic cartilage length, color-coded according to magnitude. **P<0.01; ***P<0.001 (Kruskal–Wallis test with post-hoc Dunn's test and Bonferroni correction). ns, not significant. Box plot shows the median (middle bar) and first to third interquartile ranges (boxes); whiskers indicate 1.5× the interquartile ranges; dots indicate data points. CRD, cysteine-rich domain; Ig, immunoglobulin-like domain; Kr, Kringle domain; PRD, proline-rich domain; ST1, serine-threonine domain 1; ST2, serine-threonine domain 2; TM, transmembrane domain. Scale bar: 20 μm for B-O. |