
|
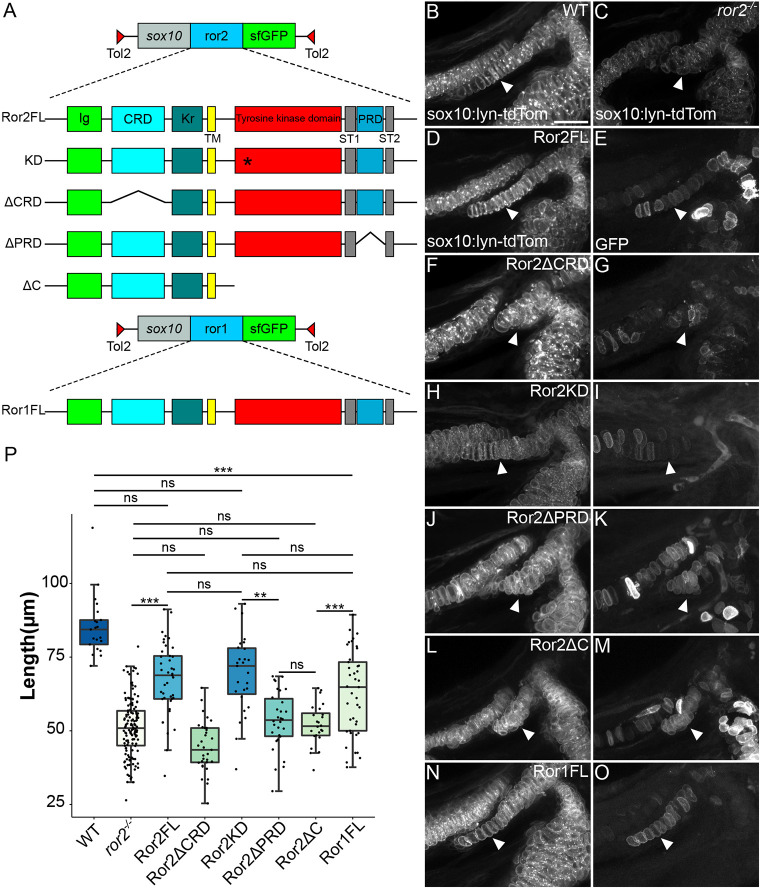
Fig. 6.
Ror2 domain analysis reveals differential requirements for cartilage stacking. (A) Schematic of ror2 transgenic constructs. A sox10 enhancer element drives expression of Ror2-SuperFolderGFP (sfGFP) fusions in a Tol2 vector. Constructs include full-length Ror2-sfGFP (Ror2FL), Ror2K509R-sfGFP (KD), Ror2ΔCRD-sfGFP (ΔCRD), Ror2ΔPRD-sfGFP (ΔPRD), Ror2ΔC-sfGFP (ΔC) and full-length Ror1 (Ror1FL). Asterisk indicates the location of the K509R mutation. (B,C) Confocal images of fluorescent cartilages at 3 dpf in WT (B) and ror2−/− (C) in a Tg(sox10:lyn-tdTomato) background. (D-O) Representative rescue construct mosaic transgenic cartilages in grayscale showing sox10:lyn-tdTomato only (D,F,H,J,L,N) or GFP only (E,G,I,K,M,O). White arrowheads indicate the symplectic cartilage. Panels B-O are z-projections. (P) Quantification of symplectic cartilage length, color-coded according to magnitude. **P<0.01; ***P<0.001 (Kruskal–Wallis test with post-hoc Dunn's test and Bonferroni correction). ns, not significant. Box plot shows the median (middle bar) and first to third interquartile ranges (boxes); whiskers indicate 1.5× the interquartile ranges; dots indicate data points. CRD, cysteine-rich domain; Ig, immunoglobulin-like domain; Kr, Kringle domain; PRD, proline-rich domain; ST1, serine-threonine domain 1; ST2, serine-threonine domain 2; TM, transmembrane domain. Scale bar: 20 μm for B-O.