
|
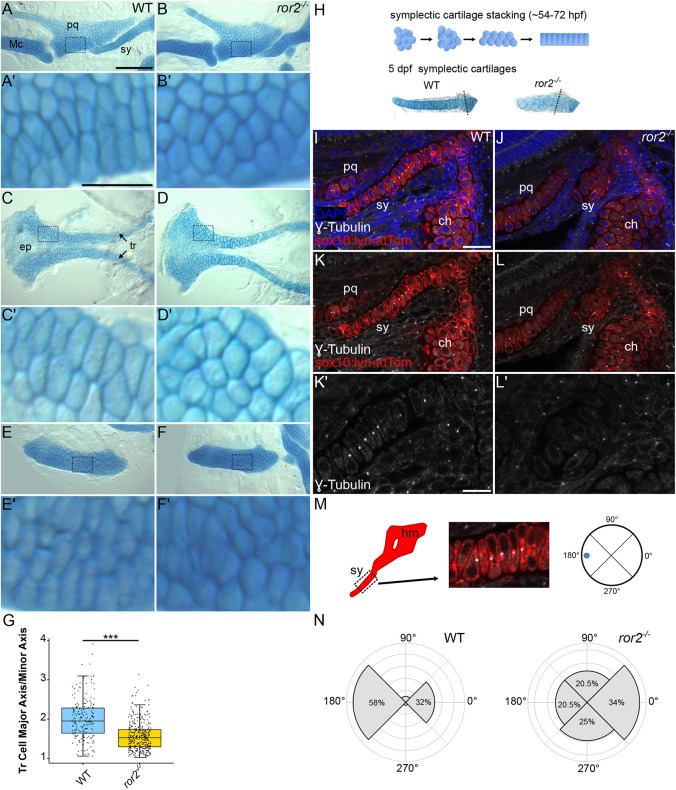
Fig. 4.
Cell polarity is disrupted in ror2 mutants. (A-F′) Wild type (WT) and ror2−/− cartilages showing Palatoquadrate cartilages (A-B′), anterior neurocrania (C-D′) and ceratohyal cartilages (E-F′). Panels A′, B′, C′, D′, E′ and F′ are magnified views of the boxed regions in panels A, B, C, D, E and F, respectively. Arrows point to trabecular cartilages. (G) Quantifications of trabecular cell major axis-to-minor axis. ***P<0.001 (Wilcoxon rank-sum test). Box plot shows the median (middle bar) and first to third interquartile ranges (boxes); whiskers indicate 1.5× the interquartile ranges; dots indicate data points. n=195 WT and 379 ror2−/− tr cells. (H) Diagram of symplectic cartilage stacking and representative examples of 5 dpf Alcian Blue-stained symplectic cartilages. (I-N) Cell polarity measurements. Representative WT (I,K) and ror2−/− (J,L) sox10:lyn-tdTomato transgenic craniofacial cartilages stained with anti-γ-tubulin antibody in white. Panels I-L′ are a single slice of a z-stack. DAPI in blue, anti-γ-tubulin in white and sox10:lyn-tdTomato in red for I-L′. Panels K′ and L′ are magnified views of symplectic cartilages in K and L, respectively. (M) Diagram of how polarity was determined in symplectic cartilages. (N) Quantification of the distribution of the microtubule-organizing center (MTOC) in WT and ror2−/− symplectic cartilage cells. P<0.001 (Watson's two-sample test for homogeneity). ch, ceratohyal cartilage; ep, ethmoid plate; hm, hyomandibula; Mc, Meckel's cartilage; pq, palatoquadrate cartilage; sy, symplectic cartilage; tr, trabecular cartilage. Scale bars: 100 μm for A,B,C,D,E,F; 25 μm for A′,B′,C′,D′,E′,F′; 20 μm for I-L; 10 μm for K′,L′.