
- Title
-
Autophagy Function and Benefits of Autophagy Induction in Models of Spinocerebellar Ataxia Type 3
- Authors
- Watchon, M., Luu, L., Plenderleith, S.K., Yuan, K.C., Laird, A.S.
- Source
- Full text @ Cells
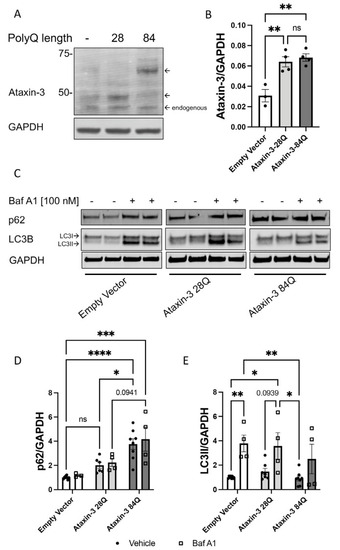
Autophagy impairment identified in a cell culture model of SCA3. (A) Western blot of SH-SY5Y cells stably expressing either an empty vector control or human ataxin-3 28Q or human ataxin-3 84Q probed for ataxin-3. (B) Quantification of human ataxin-3 levels relative to GAPDH showing increased levels of ataxin-3 in the ataxin-3 28Q and ataxin-3 84Q compared to the empty vector control (p = 0.0039 and p = 0.0019, respectively, n = 3–4). (C) Western blot of SH-SY5Y cells stably expressing either an empty vector control or human ataxin-3 28Q or human ataxin-3 84Q treated with either vehicle (DMSO) or Bafilomycin A1 (Baf A1). Western blot was probed with either p62 or LC3B. (D) Baseline levels of p62 were increased in ataxin-3 84Q cells compared to the empty vector control and ataxin-3 28Q cells (p < 0.0001 and p = 0.0301 respectively, n = 3–8). Baf A1 treatment increased p62 levels in the ataxin-3 84Q cells compared to the empty vector control (p = 0.0057).©) LC3II levels did not differ between genotypes at baseline; however, in the presence of Baf A1, empty vector cells had increased LC3II compared to vehicle treated empty vector cells (p = 0.0095). Vehicle-treated empty vector cells also had decreased LC3II levels compared to Baf A1-treated ataxin-3 28Q cells (p = 0.0193). Additionally, LC3II levels were lower in the ataxin-3 84Q cells treated with vehicle compared to the empty vector and ataxin-3 28Q in the presence of Baf A1 (p = 0.0069 and 0.0142 respectively, n = 4–8). Error bars represent mean ± SEM. Statistical analysis performed were a one-way ANOVA and two-way ANOVA followed by Tukey post hoc analysis. * represents p < 0.05, ** represents p < 0.01, *** represents p < 0.001, **** represents p < 0.0001. |
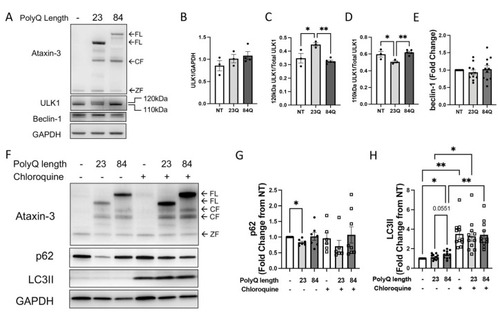
Autophagy impairment identified in SCA3 larvae. (A) Representative Western blot of EGFP-ataxin-3 zebrafish larvae aged 6 days post fertilization (dpf) and probed for ULK1 and beclin-1. (B) Quantification of ULK1 levels did not have any significant differences. (C) Quantification of the 120 kDa ULK compared to total ULK1 showed an increase in the ataxin-3 23Q zebrafish compared to the non-transgenic and ataxin-3 84Q zebrafish (p = 0.0181 and p = 0.0032, respectively, n = 3–5). (D) Quantification of the 110 kDa ULK1 compared to total ULK1 showed a decrease in the ataxin-3 23Q compared to the non-transgenic control and the ataxin-3 84Q zebrafish (p = 0.048 and p = 0.0083, n = 3–5). (E) Quantification of beclin-1 showed no differences between the genotypes (p > 0.05, n = 11). (F) Representative Western blot of EGFP-ataxin-3 zebrafish larvae treated with either chloroquine (3 mM) or vehicle control between 1–6 dpf. Western blots probed for ataxin-3, p62, and LC3B. (G) Quantification of p62 revealed decreased levels in the ataxin-3 23Q genotype compared to the non-transgenic control at baseline (p = 0.0171, n = 6–8). (H) Quantification of LC3II showed ataxin-3 84Q zebrafish had increased levels compared to the non-transgenic control at baseline (p = 0.0454, n = 11). Addition of chloroquine revealed increased LC3II levels compared to the vehicle treatment for each respective genotype (NT: p = 0.0013, ataxin-3 23Q: p = 0.0148, ataxin-3 84Q: p = 0.0044). NT-Non-transgenic, FL-full-length, CF-cleavage fragment, ZF-zebrafish. Error bars represent mean ± SEM. Statistical analysis performed were either paired one-way ANOVA followed by Tukey post hoc analysis or mixed-analysis. * represents p < 0.05, ** represents p < 0.01. |
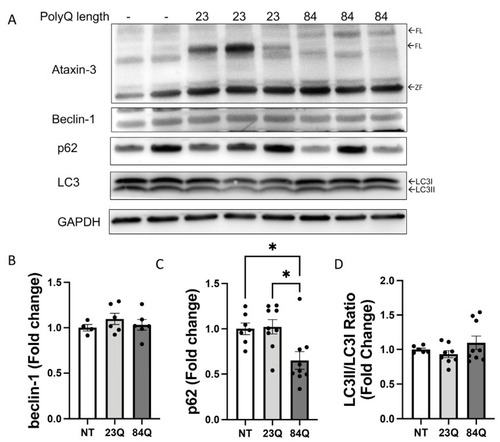
Adult SCA3 zebrafish do not exhibit impairment in the autophagy pathway. (A) Representative Western blot of 7-month-old SCA3 zebrafish brain and spinal cord protein samples. Western blot was probed with beclin-1, p62, and LC3B. (B) Quantification of beclin-1 revealed no significant differences between the genotypes (n = 4–6). (C) Quantification of p62 revealed a decrease in the ataxin-3 84Q zebrafish compared to the ataxin-3 23Q zebrafish and the non-transgenic control (p = 0.0106 and p = 0.0254, respectively, n = 7–9). (D) Quantification of LC3II/LC3I ratio showed no significant differences between the genotypes (n = 6–9). NT-Non-transgenic, FL-full-length, ZF-zebrafish. Error bars represent mean ± SEM. Data points represent individual adult zebrafish Statistical analysis performed was a one-way ANOVA followed by a Tukey post hoc analysis. * represents p < 0.05. |
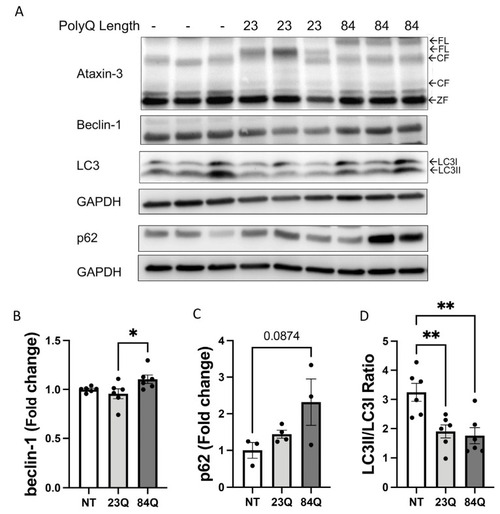
Aging SCA3 zebrafish exhibit autophagy impairment. (A) Representative Western blot of EGFP-ataxin-3 zebrafish brain and spinal cord protein samples at 18 months of age. Western blot was probed with autophagy markers beclin-1, p62, and LC3B. (B) Quantification of beclin-1 revealed increased levels in the ataxin-3 84Q group compared to ataxin-3 23Q zebrafish (p = 0.0415, n = 6). (C) Quantification of p62 showed a trend of increased p62 levels in the ataxin-3 84Q zebrafish compared to the non-transgenic control (p = 0.0874, n = 3–4). (D) Quantification of the LC3II/LC3I ratio revealed that expression of the human ataxin-3, regardless of polyQ length, decreased levels compared to the non-transgenic control (ataxin-3 23Q: p = 0.0068, ataxin-3 84Q: p = 0.0046, n = 6). NT-Non-transgenic, FL-full-length, CF-cleavage fragment; ZF-zebrafish. Error bars represent mean ± SEM. Data points represent individual adult zebrafish. Statistical analysis performed was a one-way ANOVA followed by Tukey post hoc analysis. * represents p < 0.05, ** represents p < 0.01. |
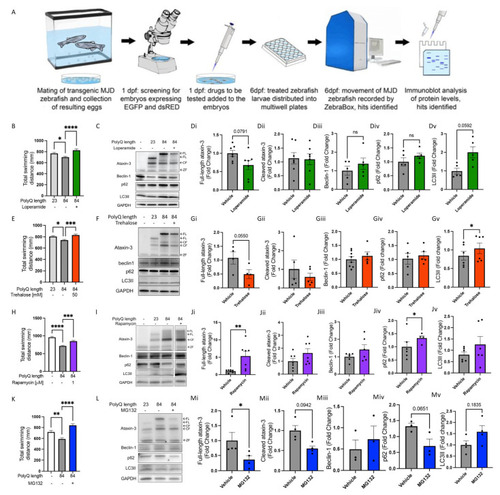
Known autophagy inducers rescue motor behaviour in transgenic SCA3 zebrafish without signs of autophagy induction. (A) Schematic of workflow of performing drug treatment studies in the SCA3 zebrafish. (B) Quantification of motor behaviour assay with and without loperamide (16 µM) treatment. (C) Representative Western blot of SCA3 zebrafish with and without loperamide treatment and probed for ataxin-3, beclin-1, p62 and LC3B. (Di–Dv) Quantification of human ataxin-3 (full-length and cleaved fragments), beclin-1, p62, and LC3II in SCA3 zebrafish with and without loperamide treatment. (E) Quantification of motor function assay of the SCA3 zebrafish when exposed to trehalose (50 mM). (F) Representative Western blot of SCA3 zebrafish treated with vehicle versus trehalose and probed for ataxin-3, beclin-1, p62, and LC3B. (Gi–Gv) Quantification of human ataxin-3 (full-length and cleaved fragments), beclin-1, p62, and LC3II. (H) Quantification of motor behaviour assay of the SCA3 zebrafish when exposed to rapamycin (1 µM). (I) Representative Western blot of SCA3 zebrafish with and without rapamycin treatment and probed for ataxin-3, beclin-1, p62, and LC3B. (Ji–Jv) Quantification of human ataxin-3 (full-length and cleaved fragments), beclin-1, p62, and LC3II. (K) Quantification of motor behaviour assay in the SCA3 zebrafish when exposed to MG132 (50 µM). (L) Representative Western blot of SCA3 zebrafish treated with MG132 and probed with ataxin-3, beclin-1, p62, and LC3B. (Mi–Mv) Quantification of human ataxin-3 (full-length and cleaved fragments), beclin-1, p62, and LC3II. NT-Non-transgenic, FL-full-length, CF-cleavage fragment ZF-zebrafish. Error bars represent mean ± SEM. Data points represent one experimental replicate consisting of 20–25 embryos per experiment. Statistical analysis performed was either a one-way ANOVA followed by Tukey post hoc analysis or paired Student’s t-test. * represents p < 0.05, ** represents p < 0.01, *** p < 0.001 and **** represents p < 0.0001. |