
|
Figure 5
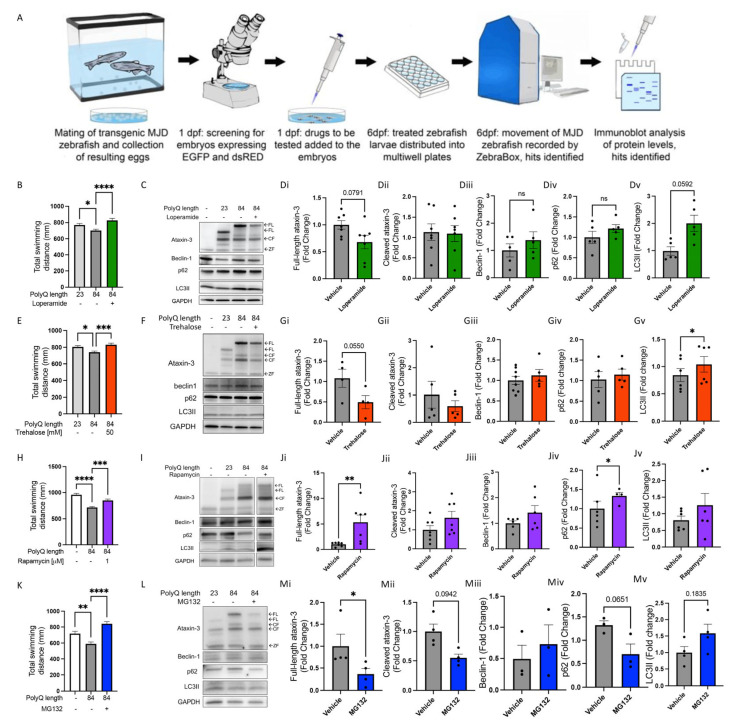
Known autophagy inducers rescue motor behaviour in transgenic SCA3 zebrafish without signs of autophagy induction. (A) Schematic of workflow of performing drug treatment studies in the SCA3 zebrafish. (B) Quantification of motor behaviour assay with and without loperamide (16 µM) treatment. (C) Representative Western blot of SCA3 zebrafish with and without loperamide treatment and probed for ataxin-3, beclin-1, p62 and LC3B. (Di–Dv) Quantification of human ataxin-3 (full-length and cleaved fragments), beclin-1, p62, and LC3II in SCA3 zebrafish with and without loperamide treatment. (E) Quantification of motor function assay of the SCA3 zebrafish when exposed to trehalose (50 mM). (F) Representative Western blot of SCA3 zebrafish treated with vehicle versus trehalose and probed for ataxin-3, beclin-1, p62, and LC3B. (Gi–Gv) Quantification of human ataxin-3 (full-length and cleaved fragments), beclin-1, p62, and LC3II. (H) Quantification of motor behaviour assay of the SCA3 zebrafish when exposed to rapamycin (1 µM). (I) Representative Western blot of SCA3 zebrafish with and without rapamycin treatment and probed for ataxin-3, beclin-1, p62, and LC3B. (Ji–Jv) Quantification of human ataxin-3 (full-length and cleaved fragments), beclin-1, p62, and LC3II. (K) Quantification of motor behaviour assay in the SCA3 zebrafish when exposed to MG132 (50 µM). (L) Representative Western blot of SCA3 zebrafish treated with MG132 and probed with ataxin-3, beclin-1, p62, and LC3B. (Mi–Mv) Quantification of human ataxin-3 (full-length and cleaved fragments), beclin-1, p62, and LC3II. NT-Non-transgenic, FL-full-length, CF-cleavage fragment ZF-zebrafish. Error bars represent mean ± SEM. Data points represent one experimental replicate consisting of 20–25 embryos per experiment. Statistical analysis performed was either a one-way ANOVA followed by Tukey post hoc analysis or paired Student’s t-test. * represents p < 0.05, ** represents p < 0.01, *** p < 0.001 and **** represents p < 0.0001.