
|
Figure 2
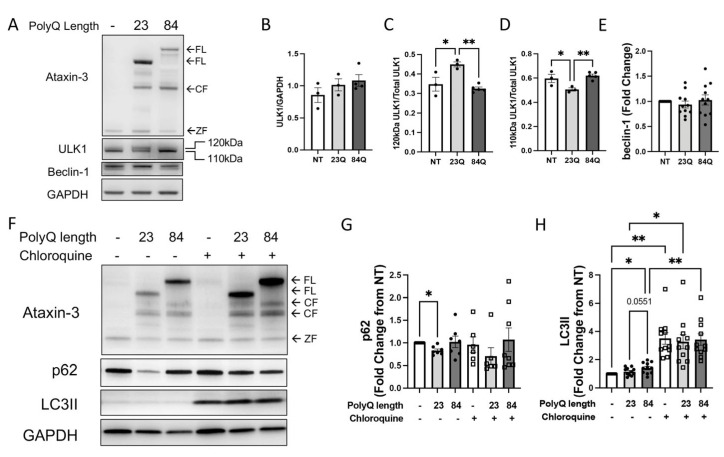
Autophagy impairment identified in SCA3 larvae. (A) Representative Western blot of EGFP-ataxin-3 zebrafish larvae aged 6 days post fertilization (dpf) and probed for ULK1 and beclin-1. (B) Quantification of ULK1 levels did not have any significant differences. (C) Quantification of the 120 kDa ULK compared to total ULK1 showed an increase in the ataxin-3 23Q zebrafish compared to the non-transgenic and ataxin-3 84Q zebrafish (p = 0.0181 and p = 0.0032, respectively, n = 3–5). (D) Quantification of the 110 kDa ULK1 compared to total ULK1 showed a decrease in the ataxin-3 23Q compared to the non-transgenic control and the ataxin-3 84Q zebrafish (p = 0.048 and p = 0.0083, n = 3–5). (E) Quantification of beclin-1 showed no differences between the genotypes (p > 0.05, n = 11). (F) Representative Western blot of EGFP-ataxin-3 zebrafish larvae treated with either chloroquine (3 mM) or vehicle control between 1–6 dpf. Western blots probed for ataxin-3, p62, and LC3B. (G) Quantification of p62 revealed decreased levels in the ataxin-3 23Q genotype compared to the non-transgenic control at baseline (p = 0.0171, n = 6–8). (H) Quantification of LC3II showed ataxin-3 84Q zebrafish had increased levels compared to the non-transgenic control at baseline (p = 0.0454, n = 11). Addition of chloroquine revealed increased LC3II levels compared to the vehicle treatment for each respective genotype (NT: p = 0.0013, ataxin-3 23Q: p = 0.0148, ataxin-3 84Q: p = 0.0044). NT-Non-transgenic, FL-full-length, CF-cleavage fragment, ZF-zebrafish. Error bars represent mean ± SEM. Statistical analysis performed were either paired one-way ANOVA followed by Tukey post hoc analysis or mixed-analysis. * represents p < 0.05, ** represents p < 0.01.