
|
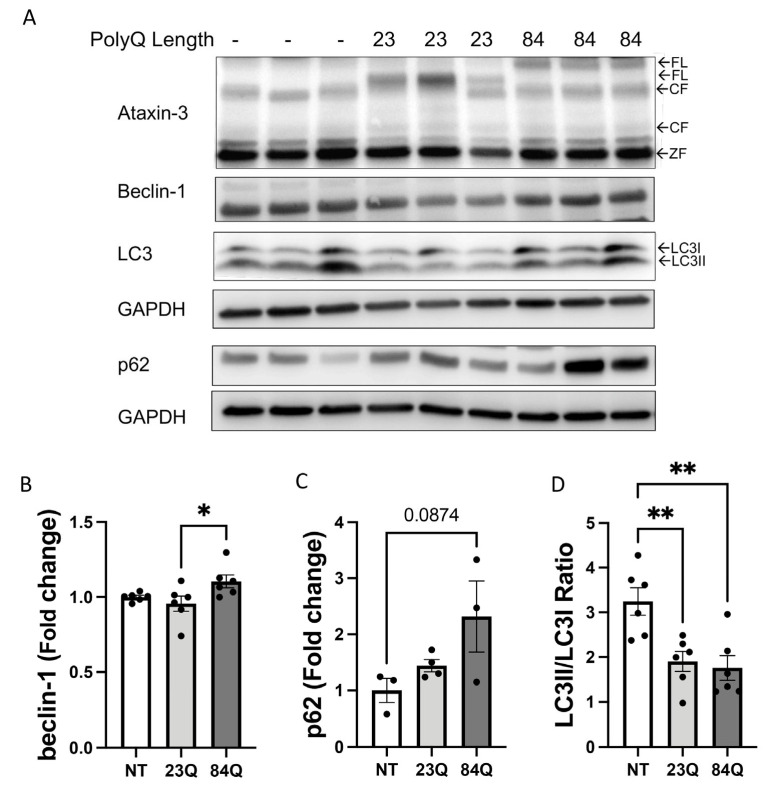
Figure 4
Aging SCA3 zebrafish exhibit autophagy impairment. (A) Representative Western blot of EGFP-ataxin-3 zebrafish brain and spinal cord protein samples at 18 months of age. Western blot was probed with autophagy markers beclin-1, p62, and LC3B. (B) Quantification of beclin-1 revealed increased levels in the ataxin-3 84Q group compared to ataxin-3 23Q zebrafish (p = 0.0415, n = 6). (C) Quantification of p62 showed a trend of increased p62 levels in the ataxin-3 84Q zebrafish compared to the non-transgenic control (p = 0.0874, n = 3–4). (D) Quantification of the LC3II/LC3I ratio revealed that expression of the human ataxin-3, regardless of polyQ length, decreased levels compared to the non-transgenic control (ataxin-3 23Q: p = 0.0068, ataxin-3 84Q: p = 0.0046, n = 6). NT-Non-transgenic, FL-full-length, CF-cleavage fragment; ZF-zebrafish. Error bars represent mean ± SEM. Data points represent individual adult zebrafish. Statistical analysis performed was a one-way ANOVA followed by Tukey post hoc analysis. * represents p < 0.05, ** represents p < 0.01.