
- Title
-
Roles of miR-196a and miR-196b in Zebrafish Motor Function
- Authors
- Yuan, C., Xie, H., Chen, X., Yuan, S.
- Source
- Full text @ Biomolecules
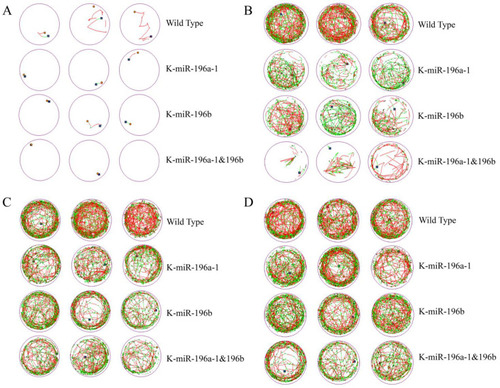
Behavioral trajectory of miR-196a-1 and miR-196b gene knockout zebrafish. The mobile trajectory was observably reduced in the miR-196a-1 or miR-196b gene knockout zebrafish group. (A): Mobile trajectory of zebrafish on the fourth day; (B): mobile trajectory on the fifth day; (C): mobile trajectory on the sixth day; (D): mobile trajectory diagram on the seventh day. WT, wild-type zebrafish; K-miR-196a-1, miR-196a-1 gene knockout zebrafish; K-miR-196b, miR-196b gene knockout zebrafish; K-miR-196a-1/196b, zebrafish with miR-196a-1 and miR-196b gene knockout. The blue square is the starting point, the orange dot is the ending point, the red and green lines are the different speeds of trajectories, the green relative speed is medium, and the red relative speed is higher. |
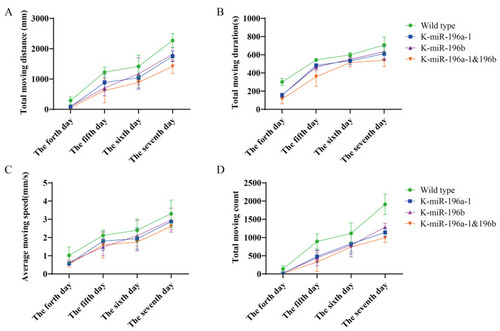
Analysis results of behavioral trajectory data of different groups of zebrafish. The green line indicates wild-type zebrafish; the blue line represents the miR-196a-1 gene knockout group (K-miR-196a-1); and the purple line represents the zebrafish of the miR-196b gene knockout group (K-miR-196b). Orange is the behavior of the miR-196a-1 and the miR-196b double mutant (K-miR-196a-1/196b). (A): The total movement distance of zebrafish (mm) was reduced in the gene knockout group, especially in the double knockout group; (B): the total movement time of zebrafish was decreased after knockout of miR-196a-1 and miR-196b; (C): the movement speed (mm/s) was decreased in the gene knockout group; (D): the movement times of the gene knockout zebrafish were decreased compared with those of the wild-type, but there were no obvious differences between the miR-196a-1 and miR-196b knockout groups. |

HE staining results of dorsal muscle tissue of zebrafish in different groups (20×).The dorsal muscle tissue was damaged when the miR-196a-1 and miR-196b genes were knocked out. (A) wild-type zebrafish; (B): zebrafish with miR-196a-1 gene knockout; (C): miR-196b gene knockout zebrafish; (D): zebrafish with miR-196a-1 and miR-196b gene knockout; -1 is the transverse section of muscle tissue, -2 is the longitudinal section of muscle tissue. The red arrow points to inflammatory cell infiltration, the black arrow points to vacuolar degeneration of muscle fibers, the blue arrow points to melanin deposition, the yellow arrow points to inward nuclear movement. PHENOTYPE:
|
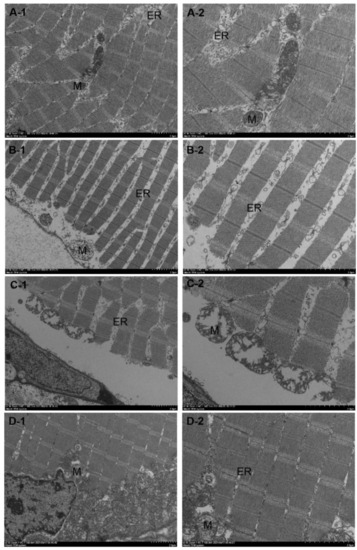
Transmission electron microscopy results of dorsal muscle tissue of miR-196a-1 and miR-196b knockout zebrafish. The zebrafish muscle tissue was damaged after miR-196a-1 or miR-196b gene knockout and mainly showed irregular morphology of muscle cells, irregular arrangement of myofibrils, sarcoplasmic reticulum dilatation, and mitochondrial swelling. (A): Wild-type zebrafish; (B): zebrafish with miR-196a-1 gene knockout; (C): miR-196b gene knockout zebrafish; (D): zebrafish with miR-196a-1 and miR-196b gene knockout; left panels: 2500×, right panels: 5000×. ER is sarcoplasmic reticulum, M is mitochondria, and N is muscle nucleus. PHENOTYPE:
|
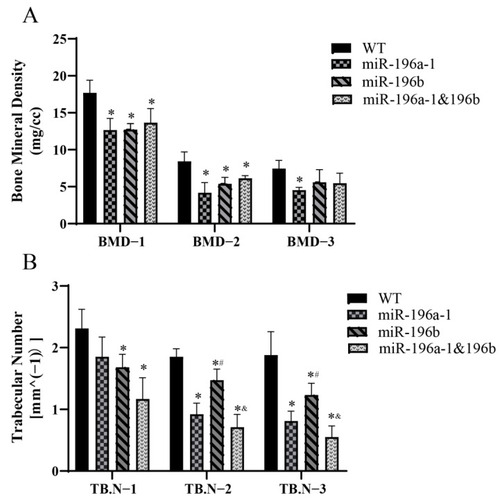
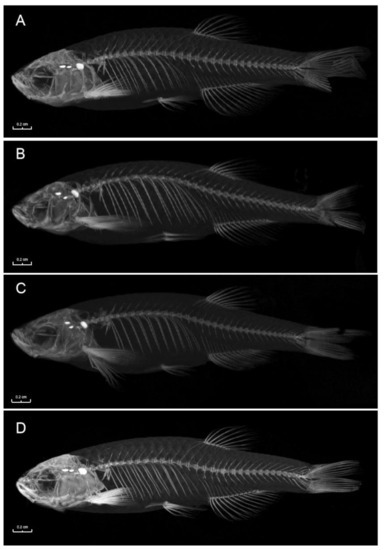
Results of bone mineral density and trabecular number in zebrafish knockout models. (A) The mineral density and (B) trabecular number were decreased in the miR-196a-1 or miR-196b knockout group. BMD-1 is the BMD or bone mineral density of the postcranial vertebra, BMD-2 is the middle spinal segment, and BMD-3 is the caudal vertebra. TB.N-1 is the trabecular number of the postcranial vertebra, TB.N-2 is the middle spinal segment, and TB.N-3 is the caudal vertebra. WT is wild-type zebrafish. K-miR-196a-1 is the miR-196a-1 gene knockout zebrafish; K-miR-196b is the miR-196b gene knockout zebrafish; K-miR-196a-1/196b is the zebrafish with miR-196a-1 and miR-196b gene knockout; compared with wild zebrafish, * p < 0.05; compared with miR-196a-1 gene knockout zebrafish, # p < 0.05; compared with miR-196b gene knockout group, & p < 0.05, n = 3. |
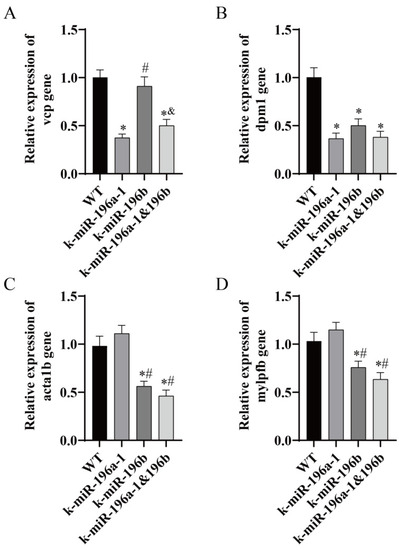
The expression of muscle-related genes in miR-196a-1 or miR-196b knockout zebrafish was determined by real-time PCR. WT indicates wild-type zebrafish; K-miR-196a-1 indicates miR-196a-1 gene knockout zebrafish; K-miR-196b indicates miR-196b gene knockout zebrafish; K-miR-196a-1/196b indicates miR-196a-1 and miR-196b gene knockout zebrafish. (A) shows the relative expression level of the vcp gene, (B) is the dpm1 gene; (C) is the acta1b gene; (D) is the mylpfb gene. Compared with wild-type zebrafish, * p < 0.05; compared with miR-196a-1 gene knockout zebrafish, # p < 0.05; compared with miR-196b gene knockout zebrafish, & p < 0.05, n = 3. |
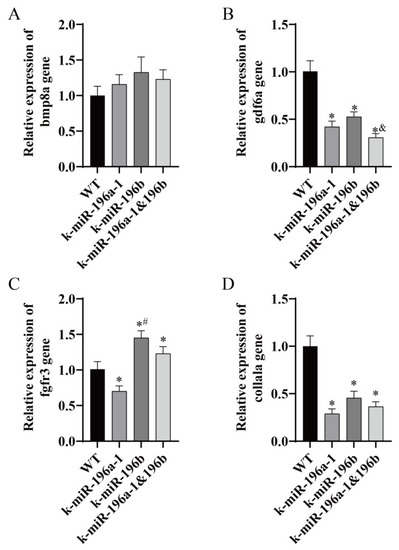
The expression of bone-related genes in miR-196a-1 or miR-196b knockout zebrafish was determined by real-time PCR. WT indicates wild-type zebrafish; K-miR-196a-1 indicates miR-196a-1 gene knockout zebrafish; K-miR-196b indicates miR-196b gene knockout zebrafish; K-miR-196a-1/196b indicates miR-196a-1 and miR-196b gene knockout zebrafish. (A) shows the relative expression level of the bmp8a gene, (B) is the gdf6a gene; (C) is the fgfr3 gene; (D) is the col1a1a gene. Compared with wild-type zebrafish, * p < 0.05; compared with miR-196a-1 gene knockout zebrafish, # p < 0.05; compared with miR-196b gene knockout zebrafish, & p < 0.05, n = 3. |