
Figure 8
- ID
- ZDB-IMAGE-230331-73
- Genes
- Publication
- Yuan et al., 2023 - Roles of miR-196a and miR-196b in Zebrafish Motor Function
- All Figures
- Figures for Yuan et al., 2023
|
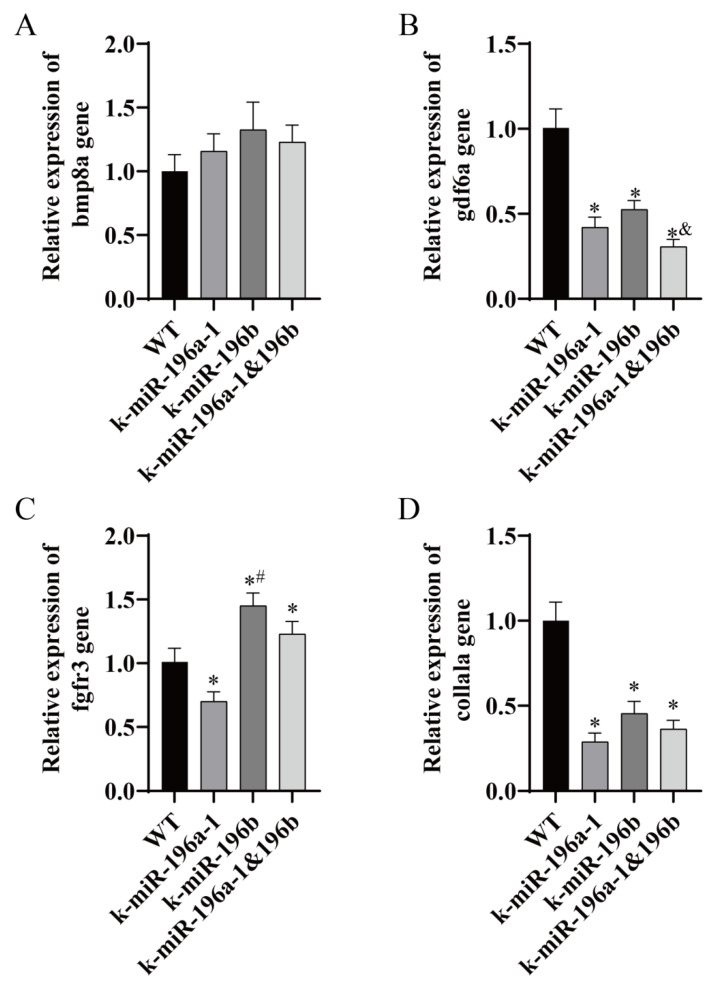
Figure 8
The expression of bone-related genes in miR-196a-1 or miR-196b knockout zebrafish was determined by real-time PCR. WT indicates wild-type zebrafish; K-miR-196a-1 indicates miR-196a-1 gene knockout zebrafish; K-miR-196b indicates miR-196b gene knockout zebrafish; K-miR-196a-1/196b indicates miR-196a-1 and miR-196b gene knockout zebrafish. (A) shows the relative expression level of the bmp8a gene, (B) is the gdf6a gene; (C) is the fgfr3 gene; (D) is the col1a1a gene. Compared with wild-type zebrafish, * p < 0.05; compared with miR-196a-1 gene knockout zebrafish, # p < 0.05; compared with miR-196b gene knockout zebrafish, & p < 0.05, n = 3.