
Figure 2
- ID
- ZDB-IMAGE-230331-67
- Publication
- Yuan et al., 2023 - Roles of miR-196a and miR-196b in Zebrafish Motor Function
- All Figures
- Figures for Yuan et al., 2023
|
Figure 2
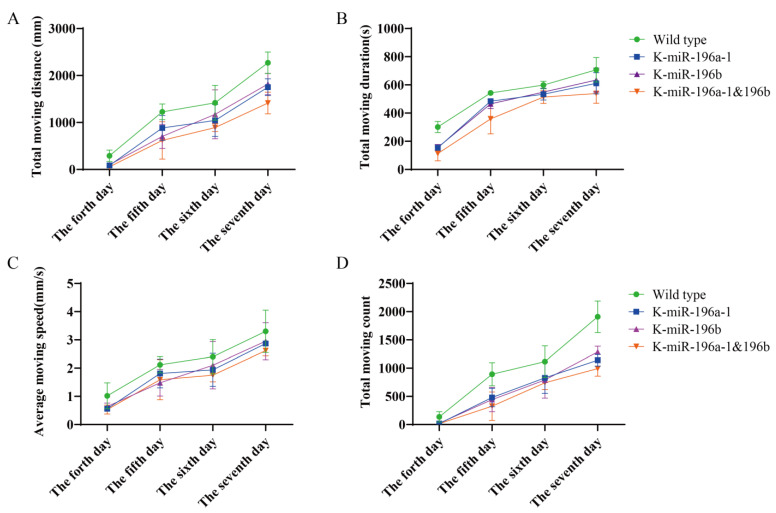
Analysis results of behavioral trajectory data of different groups of zebrafish. The green line indicates wild-type zebrafish; the blue line represents the miR-196a-1 gene knockout group (K-miR-196a-1); and the purple line represents the zebrafish of the miR-196b gene knockout group (K-miR-196b). Orange is the behavior of the miR-196a-1 and the miR-196b double mutant (K-miR-196a-1/196b). (A): The total movement distance of zebrafish (mm) was reduced in the gene knockout group, especially in the double knockout group; (B): the total movement time of zebrafish was decreased after knockout of miR-196a-1 and miR-196b; (C): the movement speed (mm/s) was decreased in the gene knockout group; (D): the movement times of the gene knockout zebrafish were decreased compared with those of the wild-type, but there were no obvious differences between the miR-196a-1 and miR-196b knockout groups.