
- Title
-
A hydraulic feedback loop between mesendoderm cell migration and interstitial fluid relocalization promotes embryonic axis formation in zebrafish
- Authors
- Huljev, K., Shamipour, S., Pinheiro, D., Preusser, F., Steccari, I., Sommer, C.M., Naik, S., Heisenberg, C.P.
- Source
- Full text @ Dev. Cell

Figure 1. Interstitial fluid accumulation requires Na+/K+-ATPase activity and relocalizes during axial mesendoderm internalization and migration (A) Schematic of interstitial fluid (IF) distribution during axial mesendoderm (ME) internalization at 6 h post fertilization (hpf); D, dorsal and S, sagittal views; EVL, enveloping layer; DC, deep cell; YSL, yolk syncytial layer. (A′) Schematic illustrating the principle of IF relocalization analysis at the dorsal side; AV, animal-vegetal axis; pink and blue rectangles indicate the regions of IF accumulation analysis at the YSL-DC and EVL-DC boundaries, respectively, during axial ME internalization and migration (black rectangle). (B, C, and E–J) Maximum intensity projections (D, dorsal view) and single cross-sections (S, sagittal view) of gsc::caax-EGFP embryos expressing EGFP within the axial ME and injected with fluorescent dextran to mark IF in control (B and C), ouabain-treated (E and F), ouabain-treated and mannitol-injected (G and H), and mannitol-injected (I and J) embryos at 6 hpf (B, E, G, and I), and 8 hpf (C, F, H, and J); dashed white lines outline the anterior axial mesendoderm/prechordal plate (ppl) and, due to the leaky nature of this transgenic reporter line, also the posterior axial ME (pam); dashed blue lines outline the IF at the EVL-DC boundary; dashed pink lines outline the IF at the YSL-DC boundary (S, sagittal view); scale bars, 100 μm. (B′, C′, and E′–J′) IF distribution profiles along the AV axis relative to the position of ppl/pam, marked by gsc::caax-EGFP expression (black lines), in control (green, B′ and C′), ouabain-treated (blue, E′ and F′), ouabain-treated and mannitol-injected (yellow, G′ and H′), and mannitol-injected (red, I′ and J′) embryos at 6 hpf (B′, E′, G′, and I′) and 8 hpf (C′, F′, H′, and J′); multi-color curves represent average values of n = 3 independent embryo replicates of the position of ppl/pam (black lines) and IF distribution at the EVL-DC (blue lines) and YSL-DC (pink lines) boundaries; arrowheads (pink) indicate the IF accumulation ahead of the ppl. (D) Schematic illustrating the experimental design. Control and ouabain-treated (1 mM, 1–3 hpf) embryos were injected with fluorescent dextran (to mark the IF) either alone or in combination with mannitol (400 mM). See also Figures S1 and S2 and Videos S1 and S2. |
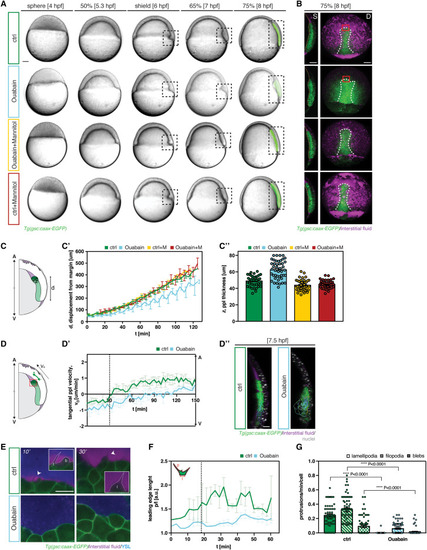
Figure 2. Interstitial fluid accumulation is required for prechordal plate cell migration (A) Bright-field and fluorescence (8 h post fertilization, hpf) images of control (green), ouabain-treated (blue), ouabain-treated and mannitol-injected (yellow), and mannitol-injected (red) gsc::caax-EGFP embryos expressing EGFP within the prechordal plate (ppl)/posterior axial mesendoderm (pam) from 4 to 8 hpf; dashed boxed region marks the zone of ppl internalization; dorsal to the right; scale bars, 100 μm. (B) Single cross-sections (S, sagittal view) and maximum intensity projections (D, dorsal view) of control (green), ouabain-treated (blue), ouabain-treated and mannitol-injected (yellow), and mannitol-injected (red) gsc::caax-EGFP embryos expressing EGFP within the ppl/pam at 8 hpf; dashed orange lines outline the yolk syncytial layer (YSL)-deep cell (DC) boundary (S, sagittal view); dashed white lines outline the ppl/pam (D, dorsal view); scale bars, 100 μm. (C) Schematic illustrating the principle of ppl distance from the margin (C′) and thickness (C″) quantification. (C′) Distance of the ppl leading edge to the germ ring margin as a function of developmental time after the onset of internalization (6 hpf, corresponding to 0′) for control (green, n = 9), ouabain-treated (blue, n = 9), ouabain-treated and mannitol-injected (yellow, n = 6), and mannitol-injected embryos (red, n = 4); mean ± SEM. (C″) Ppl thickness from 6 to 8 hpf in control (green, n = 4), ouabain-treated (blue, n = 4), ouabain-treated and mannitol-injected (yellow, n = 4), and mannitol-injected embryos (red, n = 4); mean ± SEM. (D) Schematic illustrating the principle of ppl animal-directed velocity quantification; AV, animal-vegetal axis. (D′) Animal-directed velocities of individual ppl cells in control (green, n = 5) and ouabain-treated embryos (blue, n = 4); mean ± SEM. (D″) Representative three-dimensional ppl cell tracks (7.5 hpf) in control (green) and ouabain-treated (blue) gsc::caax-EGFP embryos at 7.5 hpf; sagittal views. (E) High resolution images of the ppl leading edge (dorsal view; red boxed region in B) in control (green) and ouabain-treated (blue) gsc::caax-EGFP transgenic embryos expressing EGFP within the ppl/pam at the onset (10′) and progression (30′) of ppl migration; interstitial fluid (IF) and YSL were labeled by injection of fluorescent dextrans to gain contrast; arrowheads/inserts show the extension of an exemplary filopodium (f), bleb (b), and lamellipodium (l) in the direction of migration; scale bars, 20 μm. (F) Quantification of normalized ppl leading edge length in control (green, n = 3) and ouabain-treated (blue, n = 3) embryos; dashed black line marks the detachment of the DCs from the YSL and onset of IF accumulation. (G) Number of lamellipodia, filopodia, and blebs per time frame, normalized for the number of cells in control (green, n = 3) and ouabain-treated (blue, n = 3) embryos; individually plotted values represent protrusion numbers per minute and cell; mean ± SEM; Mann-Whitney test. n, number of independent embryo replicates. See also Figure S3 and Video S2. |
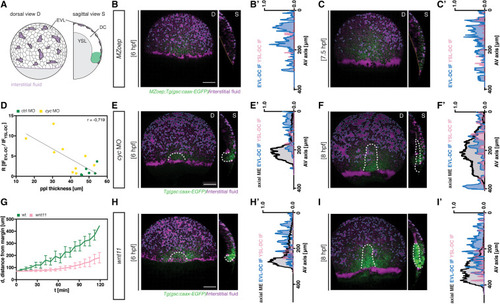
Figure 3. Axial mesendoderm internalization is required for efficient interstitial fluid relocalization (A) Schematic of interstitial fluid (IF) distribution at 6 h post fertilization (hpf) (onset of prechordal plate [ppl] internalization in wild-type [WT] embryos) in MZoep;gsc::caax-EGFP embryos; D, dorsal and S, sagittal views; EVL, enveloping layer; DC, deep cell; YSL, yolk syncytial layer. (B, C, E, F, H, and I) Maximum intensity projections (D, dorsal view) and single cross-sections (S, sagittal view) of MZoep (B and C), cyc morphant (MO, 4 ng) (E and F), and slb/wnt11f2 (H and I) gsc::caax-EGFP embryos at 6 hpf (B, E, and H) and 8 hpf (C, F, and I); for control embryos see (Figures 1B and 1C); dashed orange lines outline the YSL-DC boundary (S, sagittal view) in MZoep embryos; dashed white lines outline the ppl and, due to the leaky nature of this transgenic reporter line, also the posterior axial mesendoderm (pam); dashed blue lines outline the IF at the EVL-DC boundary; dashed pink lines outline the IF at the YSL-DC boundary (S, sagittal view); scale bars, 100 μm. (B′, C′, E′, F′, H′, and I′) IF distribution profiles along the animal-vegetal (AV) axis in MZoep mutant (B′ and C′), cyc MO (E′ and F′), and slb/wnt11f2 (H′ and I′) embryos relative to the position of ppl/pam, as indicated by gsc::caax-EGFP expression at 6 hpf (B′, E′, and H′) and 8 hpf (C′, F′, and I′); multi-color curves represent average values of n = 3 independent embryo replicates of the position of ppl/pam (black lines) and IF distribution at the EVL-DC (blue lines) and YSL-DC (pink lines) boundaries. (D) Correlation between IF relocalization and ppl thickness in control (green, n = 5) and cyc MO embryos (yellow, n = 4). Pearson correlation coefficient (r) is shown. (G) Distance of the ppl transplant leading edge from the germ ring margin as a function of developmental time (6 hpf, corresponding to 0′) in WT (green, n = 10) and slb/wnt11f2 (pink, n = 11) gsc::caax-EGFP embryos; mean ± SEM. n, number of independent embryo replicates. See also Figure S4. |
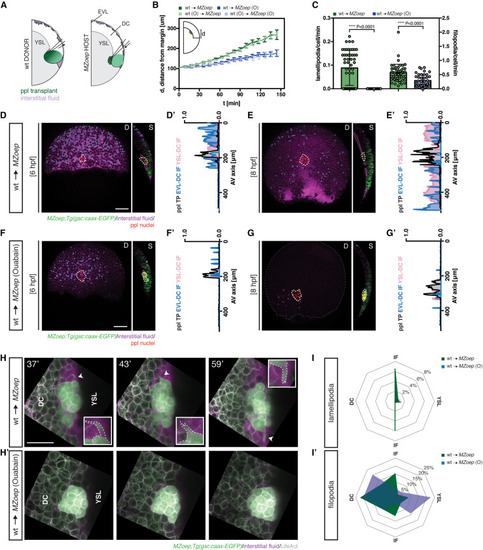
Figure 4. Prechordal plate migration is sufficient for interstitial fluid relocalization (A) Schematic of interstitial fluid (IF) distribution at 6 h post fertilization (hpf) (onset of prechordal plate [ppl] internalization in wild-type [WT] embryos) in MZoep gsc::caax-EGFP embryos containing transplanted ppl cells; D, dorsal and S, sagittal views; EVL, enveloping layer; DC, deep cell; YSL, yolk syncytial layer. (B) Distance of the ppl transplant leading edge from the germ margin as a function of developmental time (6 hpf, corresponding to 0′) in control (green, n = 6) and ouabain (O)-treated (blue, n = 9) MZoep;gsc::caax-EGFP host embryos containing untreated ppl cells, and control (light green, n = 4) and ouabain-treated (light blue, n = 2) MZoep;gsc::caax-EGFP host embryos containing ouabain-treated ppl cells; N, number of independent embryo replicates; schematic of distance measurements in upper left corner; mean ± SEM. (C) Number of lamellipodia and filopodia per time frame, normalized for the number of cells, in ppl cells taken from gsc::caax-EGFP donor embryos injected with LifeAct-RFP mRNA (50 pg) and transplanted into control (green, n = 3) and ouabain-treated (blue, n = 3) MZoep;gsc::caax-EGFP host embryos; individually plotted values represent protrusion numbers per minute and cell; mean ± SEM; Mann-Whitney test. (D–G) Maximum intensity projections (D, dorsal view) and single cross-sections (S, sagittal view) of MZoep (D and E) and ouabain-treated MZoep (F and G) gsc::caax-EGFP embryos containing transplanted ppl cells at 6 (D and F) and 8 hpf (E and G); for control embryos see Figures 1B and 1C; dashed white lines outline the ppl transplant; dashed blue lines outline the IF at the EVL-DC boundary (S, sagittal view); dashed pink lines outline the IF at the YSL-DC boundary (S, sagittal view); scale bars, 100 μm. (D′–G′) IF distribution profiles along the animal-vegetal (AV) axis relative to the position of ppl transplant, as indicated by gsc::caax-EGFP expression, in MZoep (D′ and E′) and ouabain-treated MZoep (F′ and G′) gsc::caax-EGFP embryos containing transplanted ppl cells at 6 (D′ and F′) and 8 hpf (E′ and G′); multi-color curves represent average values of n = 3 independent embryo replicates of the position of ppl/pam (black lines) and IF distribution at the EVL-DC (blue lines) and YSL-DC (pink lines) boundaries. (H) High resolution images of ppl cells taken from gsc::caax-EGFP donor embryos injected with LifeAct-RFP mRNA (50 pg) and transplanted into control and ouabain-treated MZoep;gsc::caax-EGFP host embryos injected with fluorescent dextran to label the IF at different times after transplantation (37′, 43′, and 59′, with 0′ corresponding to 6 hpf); arrowheads/inserts show the extension of an exemplary lamellipodium toward contact-free, IF-filled space; scale bars, 50 μm. (I,I') Orientation of lamellipodia (I) and filopodia (I′) per time frame, normalized for the number of ppl cells, taken from gsc::caax-EGFP donor embryos injected with LifeAct-RFP mRNA (50 pg) and transplanted into control (green, n = 3) and ouabain-treated (blue, n = 3) MZoep;gsc::caax-EGFP host embryos injected with fluorescent dextran to label the IF. n, number of independent embryo replicates. See also Figure S4 and Video S3. |
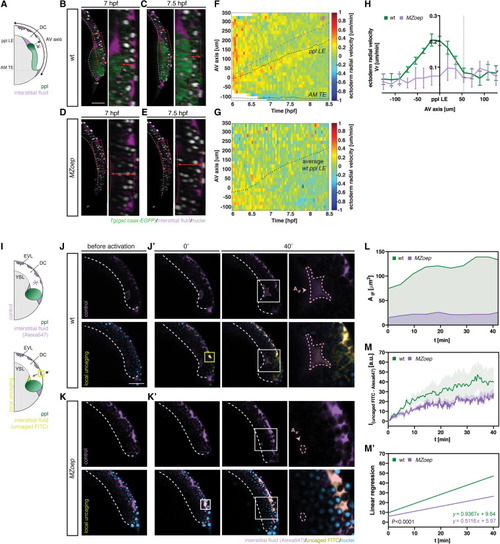
Figure 5. Prechordal plate migration triggers interstitial fluid relocalization by pushing against the overlying epiblast (A) Schematic of deep cell (DC) radial velocity (Vr) analysis relative to the prechordal plate (ppl) position; ppl leading edge (LE); axial mesendoderm trailing edge (AM TE); animal-vegetal (AV) axis. (B–E) Representative cross-sections (right panel, close-up on the DC region marked by the red box in the left panel) in gsc::caax-EGFP wild-type (WT) (B and C) and MZoep (D and E) embryos at 7 (B and D) and 7.5 hpf (C and E); dashed white line outlines the yolk syncytial layer (YSL)-DC boundary; dashed red line outlines the deformation of the DC tissue relative to the ppl position; scale bars, 100 μm. (F and G) Representative heatmaps of DC radial displacement along the AV axis as a function of developmental time in gsc::caax-EGFP WT (F) and MZoep (G) embryos; dotted black lines mark the position of the ppl LE (top) and the position of AM TE (bottom); dashed magenta line indicates the position of the interstitial fluid (IF) ahead of the ppl LE; in (G), the position of ppl LE was superimposed from an average value of ppl position in WT embryos; DC radial velocities are color-coded. (H) Average DC radial velocities relative to the ppl LE position in gsc::caax-EGFP WT (n = 4) and MZoep (n = 3) embryos; dashed line at ∼50 μm indicates the maximum position along the AV axis at which ppl-mediated radial DC movements are still detectable of the ppl LE; mean ± SEM. (I) Schematic of IF distribution visualized by a uniformly distributed control dye (top panel) and local ultraviolet (UV) laser photoactivation/uncaging of a caged dye within the IF at the enveloping layer (EVL)-DC boundary, ahead and above of the internalizing ppl (yellow square), and detection of the uncaged dye at the YSL-DC boundary (pink dashed square), ahead of the advancing ppl (bottom panel). (J–K′) Representative cross-sections of gsc::caax-EGFP WT (J and J′) and MZoep (K and K′) embryos before (50% epiboly; J and K) and after UV laser activation (0′ and 40′, J′ and K′); panels on the right in (J′) and (K′) are close-up views of the indicated regions in the left panels (40′) with dashed pink lines outlining the growing IF accumulation at the YSL-DC boundary, where the accumulation of uncaged-FITC was quantified; top row, control dye (Alexa647) uniformly marking the IF; bottom row, uncaged-FITC distribution; yellow squares mark the UV laser activation site; dashed white lines outline the YSL-DC boundary; scale bars, 100 μm. (L–M′) IF accumulation area at the YSL-DC boundary ahead of the ppl (L), and corresponding accumulation of uncaged-FITC within that region (M and M′) in gsc::caax-EGFP WT (green area; green line; n = 4) and MZoep (purple area; purple line; n = 4) embryos as a function of time after the onset of internalization (6 hpf) at 0′; values represent the mean. n, number of independent embryo replicates. See also Figure S5 and Videos S4 and S5. |

Figure 6. Magnetic bead pulling induces interstitial fluid accumulation at the yolk syncytial layer-deep cell boundary (A) Schematic of mechanical induction of interstitial fluid (IF) relocalization by a controlled displacement of a magnetic bead, implanted at the YSL (yolk syncytial layer)-deep cell (DC) boundary of an MZoep embryo, using a focused magnetic field; embryo was held by a blunt micropipette (d = 80 μm); EVL, enveloping layer. (B, B′, E, and E′) Representative cross-sections of the magnetic tweezer experiments with unpulled (B and B′) and pulled magnetic beads (E and E′) at the start of the experiment (B and E) and 15′ later (B′ and E′); dashed white line outlines the IF accumulation at the YSL-DC boundary; scale bars, 200 μm. (C and F) Representative cross-section images of non-pulled (C) and pulled (F) magnetic beads at the YSL-DC boundary where the trajectory of bead movement is projected over a period of 15′; time is color-coded; dashed white line marks the position of the magnetic tweezer; scale bars, 250 μm. (D and G) Representative kymographs of IF accumulation relative to the position of the magnetic bead, either unpulled (D) or pulled (G), via a focused magnetic field. (H) Schematic illustrating the embryo orientation during IF relocalization by a controlled displacement of a magnetic bead, implanted at the YSL-DC boundary of an MZoep embryo; AV, animal-vegetal axis. (I and J) Maximum intensity projections and single cross-sections (S, sagittal view) of MZoep;gsc::caax-EGFP embryos injected with fluorescent dextran to mark IF during mechanical induction of interstitial fluid (IF) at the beginning of the experiment (I) and 15′ after the pull (J); dashed white circles outline implanted magnetic beads; dashed blue lines outline the IF at the EVL-DC boundary; dashed pink lines outline the IF at the YSL-DC boundary (sagittal view, S); scale bars, 100 μm. (I′ and J′) IF distribution profiles along the axis of controlled displacement of a magnetic bead at the beginning of the experiment (I′) and 15′ after the pull (J′); multi-color curves represent average values of n = 3 independent embryo replicates of the position of magnetic bead (black lines) and IF distribution at the EVL-DC (blue lines) and YSL-DC (pink lines) boundaries; arrowheads (pink) indicate the IF accumulation ahead of the ppl. See also Video S6. |
Reprinted from Developmental Cell, 58(7), Huljev, K., Shamipour, S., Pinheiro, D., Preusser, F., Steccari, I., Sommer, C.M., Naik, S., Heisenberg, C.P., A hydraulic feedback loop between mesendoderm cell migration and interstitial fluid relocalization promotes embryonic axis formation in zebrafish, 582-596.e7, Copyright (2023) with permission from Elsevier. Full text @ Dev. Cell