
|
Fig. 2
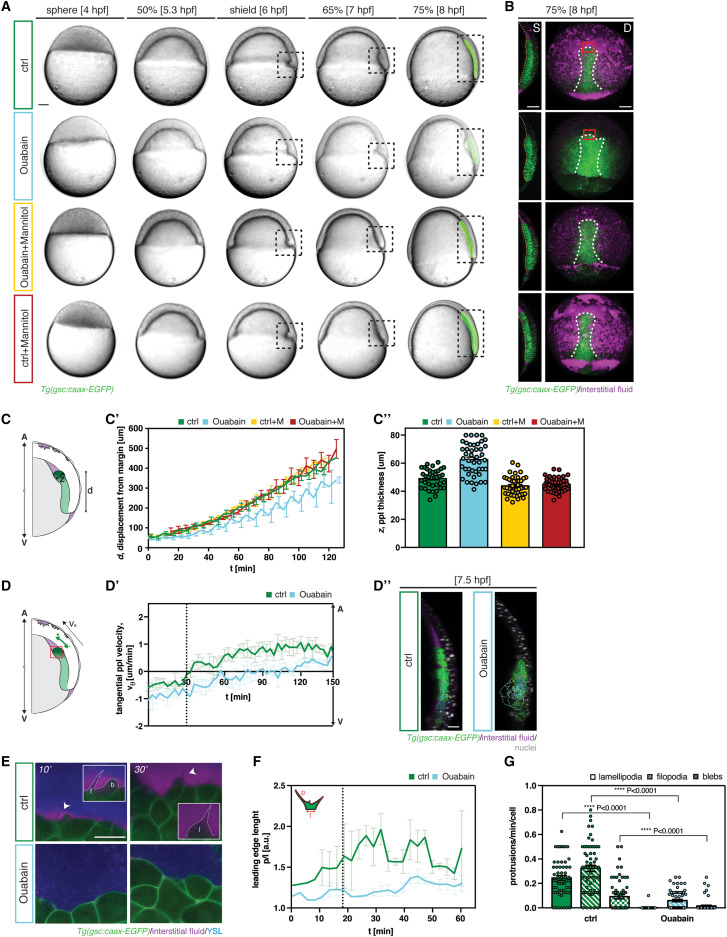
Figure 2. Interstitial fluid accumulation is required for prechordal plate cell migration (A) Bright-field and fluorescence (8 h post fertilization, hpf) images of control (green), ouabain-treated (blue), ouabain-treated and mannitol-injected (yellow), and mannitol-injected (red) gsc::caax-EGFP embryos expressing EGFP within the prechordal plate (ppl)/posterior axial mesendoderm (pam) from 4 to 8 hpf; dashed boxed region marks the zone of ppl internalization; dorsal to the right; scale bars, 100 μm. (B) Single cross-sections (S, sagittal view) and maximum intensity projections (D, dorsal view) of control (green), ouabain-treated (blue), ouabain-treated and mannitol-injected (yellow), and mannitol-injected (red) gsc::caax-EGFP embryos expressing EGFP within the ppl/pam at 8 hpf; dashed orange lines outline the yolk syncytial layer (YSL)-deep cell (DC) boundary (S, sagittal view); dashed white lines outline the ppl/pam (D, dorsal view); scale bars, 100 μm. (C) Schematic illustrating the principle of ppl distance from the margin (C′) and thickness (C″) quantification. (C′) Distance of the ppl leading edge to the germ ring margin as a function of developmental time after the onset of internalization (6 hpf, corresponding to 0′) for control (green, n = 9), ouabain-treated (blue, n = 9), ouabain-treated and mannitol-injected (yellow, n = 6), and mannitol-injected embryos (red, n = 4); mean ± SEM. (C″) Ppl thickness from 6 to 8 hpf in control (green, n = 4), ouabain-treated (blue, n = 4), ouabain-treated and mannitol-injected (yellow, n = 4), and mannitol-injected embryos (red, n = 4); mean ± SEM. (D) Schematic illustrating the principle of ppl animal-directed velocity quantification; AV, animal-vegetal axis. (D′) Animal-directed velocities of individual ppl cells in control (green, n = 5) and ouabain-treated embryos (blue, n = 4); mean ± SEM. (D″) Representative three-dimensional ppl cell tracks (7.5 hpf) in control (green) and ouabain-treated (blue) gsc::caax-EGFP embryos at 7.5 hpf; sagittal views. (E) High resolution images of the ppl leading edge (dorsal view; red boxed region in B) in control (green) and ouabain-treated (blue) gsc::caax-EGFP transgenic embryos expressing EGFP within the ppl/pam at the onset (10′) and progression (30′) of ppl migration; interstitial fluid (IF) and YSL were labeled by injection of fluorescent dextrans to gain contrast; arrowheads/inserts show the extension of an exemplary filopodium (f), bleb (b), and lamellipodium (l) in the direction of migration; scale bars, 20 μm. (F) Quantification of normalized ppl leading edge length in control (green, n = 3) and ouabain-treated (blue, n = 3) embryos; dashed black line marks the detachment of the DCs from the YSL and onset of IF accumulation. (G) Number of lamellipodia, filopodia, and blebs per time frame, normalized for the number of cells in control (green, n = 3) and ouabain-treated (blue, n = 3) embryos; individually plotted values represent protrusion numbers per minute and cell; mean ± SEM; Mann-Whitney test. n, number of independent embryo replicates. See also Figure S3 and Video S2.
Reprinted from Developmental Cell, 58(7), Huljev, K., Shamipour, S., Pinheiro, D., Preusser, F., Steccari, I., Sommer, C.M., Naik, S., Heisenberg, C.P., A hydraulic feedback loop between mesendoderm cell migration and interstitial fluid relocalization promotes embryonic axis formation in zebrafish, 582-596.e7, Copyright (2023) with permission from Elsevier. Full text @ Dev. Cell