
Fig. 5
- ID
- ZDB-FIG-230904-30
- Publication
- Huljev et al., 2023 - A hydraulic feedback loop between mesendoderm cell migration and interstitial fluid relocalization promotes embryonic axis formation in zebrafish
- Other Figures
- All Figure Page
- Back to All Figure Page
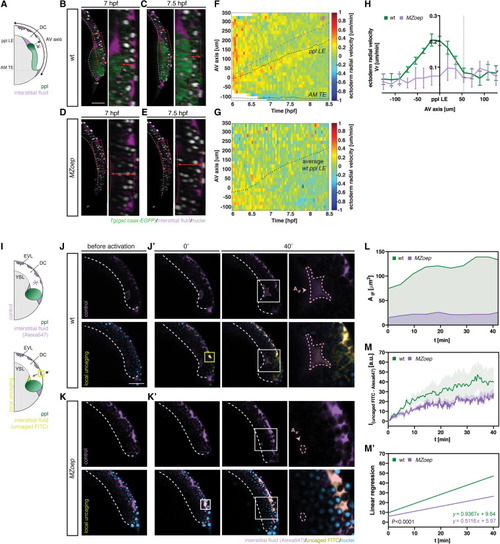
Figure 5. Prechordal plate migration triggers interstitial fluid relocalization by pushing against the overlying epiblast (A) Schematic of deep cell (DC) radial velocity (Vr) analysis relative to the prechordal plate (ppl) position; ppl leading edge (LE); axial mesendoderm trailing edge (AM TE); animal-vegetal (AV) axis. (B–E) Representative cross-sections (right panel, close-up on the DC region marked by the red box in the left panel) in gsc::caax-EGFP wild-type (WT) (B and C) and MZoep (D and E) embryos at 7 (B and D) and 7.5 hpf (C and E); dashed white line outlines the yolk syncytial layer (YSL)-DC boundary; dashed red line outlines the deformation of the DC tissue relative to the ppl position; scale bars, 100 μm. (F and G) Representative heatmaps of DC radial displacement along the AV axis as a function of developmental time in gsc::caax-EGFP WT (F) and MZoep (G) embryos; dotted black lines mark the position of the ppl LE (top) and the position of AM TE (bottom); dashed magenta line indicates the position of the interstitial fluid (IF) ahead of the ppl LE; in (G), the position of ppl LE was superimposed from an average value of ppl position in WT embryos; DC radial velocities are color-coded. (H) Average DC radial velocities relative to the ppl LE position in gsc::caax-EGFP WT (n = 4) and MZoep (n = 3) embryos; dashed line at ∼50 μm indicates the maximum position along the AV axis at which ppl-mediated radial DC movements are still detectable of the ppl LE; mean ± SEM. (I) Schematic of IF distribution visualized by a uniformly distributed control dye (top panel) and local ultraviolet (UV) laser photoactivation/uncaging of a caged dye within the IF at the enveloping layer (EVL)-DC boundary, ahead and above of the internalizing ppl (yellow square), and detection of the uncaged dye at the YSL-DC boundary (pink dashed square), ahead of the advancing ppl (bottom panel). (J–K′) Representative cross-sections of gsc::caax-EGFP WT (J and J′) and MZoep (K and K′) embryos before (50% epiboly; J and K) and after UV laser activation (0′ and 40′, J′ and K′); panels on the right in (J′) and (K′) are close-up views of the indicated regions in the left panels (40′) with dashed pink lines outlining the growing IF accumulation at the YSL-DC boundary, where the accumulation of uncaged-FITC was quantified; top row, control dye (Alexa647) uniformly marking the IF; bottom row, uncaged-FITC distribution; yellow squares mark the UV laser activation site; dashed white lines outline the YSL-DC boundary; scale bars, 100 μm. (L–M′) IF accumulation area at the YSL-DC boundary ahead of the ppl (L), and corresponding accumulation of uncaged-FITC within that region (M and M′) in gsc::caax-EGFP WT (green area; green line; n = 4) and MZoep (purple area; purple line; n = 4) embryos as a function of time after the onset of internalization (6 hpf) at 0′; values represent the mean. n, number of independent embryo replicates. See also Figure S5 and Videos S4 and S5. |
Reprinted from Developmental Cell, 58(7), Huljev, K., Shamipour, S., Pinheiro, D., Preusser, F., Steccari, I., Sommer, C.M., Naik, S., Heisenberg, C.P., A hydraulic feedback loop between mesendoderm cell migration and interstitial fluid relocalization promotes embryonic axis formation in zebrafish, 582-596.e7, Copyright (2023) with permission from Elsevier. Full text @ Dev. Cell