
|
Fig. 4
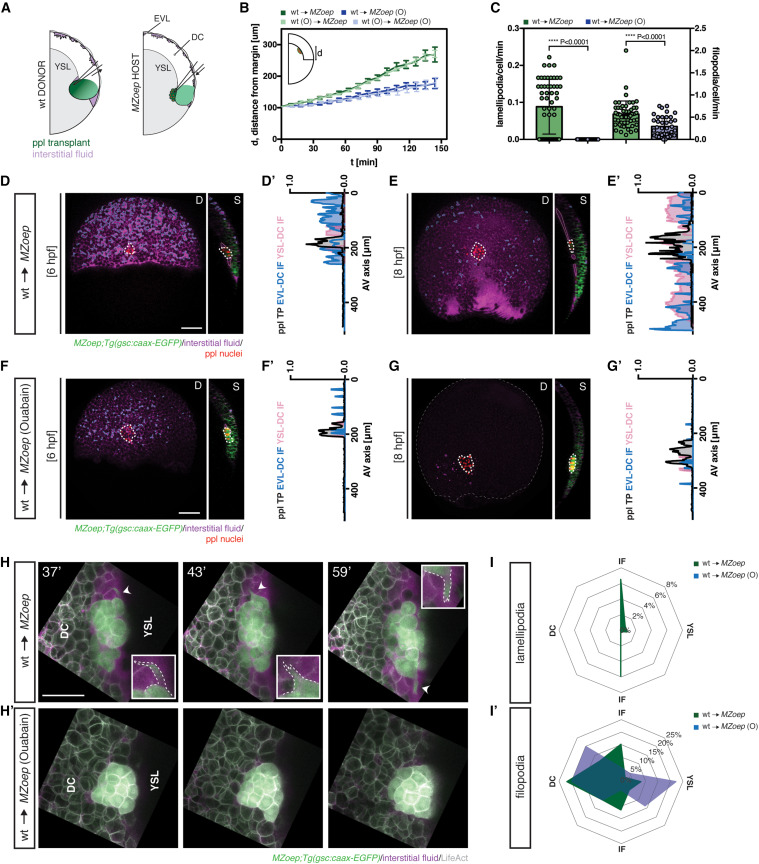
Figure 4. Prechordal plate migration is sufficient for interstitial fluid relocalization (A) Schematic of interstitial fluid (IF) distribution at 6 h post fertilization (hpf) (onset of prechordal plate [ppl] internalization in wild-type [WT] embryos) in MZoep gsc::caax-EGFP embryos containing transplanted ppl cells; D, dorsal and S, sagittal views; EVL, enveloping layer; DC, deep cell; YSL, yolk syncytial layer. (B) Distance of the ppl transplant leading edge from the germ margin as a function of developmental time (6 hpf, corresponding to 0′) in control (green, n = 6) and ouabain (O)-treated (blue, n = 9) MZoep;gsc::caax-EGFP host embryos containing untreated ppl cells, and control (light green, n = 4) and ouabain-treated (light blue, n = 2) MZoep;gsc::caax-EGFP host embryos containing ouabain-treated ppl cells; N, number of independent embryo replicates; schematic of distance measurements in upper left corner; mean ± SEM. (C) Number of lamellipodia and filopodia per time frame, normalized for the number of cells, in ppl cells taken from gsc::caax-EGFP donor embryos injected with LifeAct-RFP mRNA (50 pg) and transplanted into control (green, n = 3) and ouabain-treated (blue, n = 3) MZoep;gsc::caax-EGFP host embryos; individually plotted values represent protrusion numbers per minute and cell; mean ± SEM; Mann-Whitney test. (D–G) Maximum intensity projections (D, dorsal view) and single cross-sections (S, sagittal view) of MZoep (D and E) and ouabain-treated MZoep (F and G) gsc::caax-EGFP embryos containing transplanted ppl cells at 6 (D and F) and 8 hpf (E and G); for control embryos see Figures 1B and 1C; dashed white lines outline the ppl transplant; dashed blue lines outline the IF at the EVL-DC boundary (S, sagittal view); dashed pink lines outline the IF at the YSL-DC boundary (S, sagittal view); scale bars, 100 μm. (D′–G′) IF distribution profiles along the animal-vegetal (AV) axis relative to the position of ppl transplant, as indicated by gsc::caax-EGFP expression, in MZoep (D′ and E′) and ouabain-treated MZoep (F′ and G′) gsc::caax-EGFP embryos containing transplanted ppl cells at 6 (D′ and F′) and 8 hpf (E′ and G′); multi-color curves represent average values of n = 3 independent embryo replicates of the position of ppl/pam (black lines) and IF distribution at the EVL-DC (blue lines) and YSL-DC (pink lines) boundaries. (H) High resolution images of ppl cells taken from gsc::caax-EGFP donor embryos injected with LifeAct-RFP mRNA (50 pg) and transplanted into control and ouabain-treated MZoep;gsc::caax-EGFP host embryos injected with fluorescent dextran to label the IF at different times after transplantation (37′, 43′, and 59′, with 0′ corresponding to 6 hpf); arrowheads/inserts show the extension of an exemplary lamellipodium toward contact-free, IF-filled space; scale bars, 50 μm. (I,I') Orientation of lamellipodia (I) and filopodia (I′) per time frame, normalized for the number of ppl cells, taken from gsc::caax-EGFP donor embryos injected with LifeAct-RFP mRNA (50 pg) and transplanted into control (green, n = 3) and ouabain-treated (blue, n = 3) MZoep;gsc::caax-EGFP host embryos injected with fluorescent dextran to label the IF. n, number of independent embryo replicates. See also Figure S4 and Video S3.
Reprinted from Developmental Cell, 58(7), Huljev, K., Shamipour, S., Pinheiro, D., Preusser, F., Steccari, I., Sommer, C.M., Naik, S., Heisenberg, C.P., A hydraulic feedback loop between mesendoderm cell migration and interstitial fluid relocalization promotes embryonic axis formation in zebrafish, 582-596.e7, Copyright (2023) with permission from Elsevier. Full text @ Dev. Cell