
- Title
-
Vitamin D influences gut microbiota and acetate production in zebrafish (Danio rerio) to promote intestinal immunity against invading pathogens
- Authors
- Liao, X., Lan, Y., Wang, W., Zhang, J., Shao, R., Yin, Z., Gudmundsson, G.H., Bergman, P., Mai, K., Ai, Q., Wan, M.
- Source
- Full text @ Gut Microbes
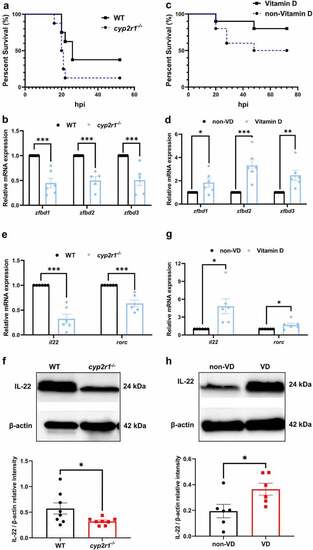
VD strengthened the intestinal health and antimicrobial responses in zebrafish. (a) WT and cyp2r1-/- zebrafish at 3 mpf were i.p. injected with 107 CFU E. tarda per fish. The survival rate of each genotype was recorded as survival rate curves (n = 8/genotype). (b) The gene expression of zfbd1, zfbd2, zfbd3 in the intestine of WT and cyp2r1-/- zebrafish was analyzed by qRT-PCR. (c-d) Zebrafish at 2 mpf were fed with the diet containing 0 or 800 IU/kg VD3 for 4 weeks. Thereafter, zebrafish were i.p. injected with 106 CFU E. tarda per fish (n = 10/group), and the survival rate of each genotype was recorded (c). Furthermore, the gene expression of zfbd1, zfbd2, zfbd3 in zebrafish intestine was analyzed (d). (e-f) The gene expression of il22 and rorc (e), as well as the protein level of IL-22 (f) in the intestine of WT and cyp2r1-/- zebrafish was assessed. In addition, (g-h) the gene expression of il22 and rorc (g), and the protein level of IL-22 (h) in the zebrafish fed non-VD or VD-containing diet was analyzed. The images are representative of the results from western blots. *p < 0.05, **p < 0.01, ***p < 0.001. WT, wild type; zfbd, zebrafish β-defensin. See also Figures S1. |
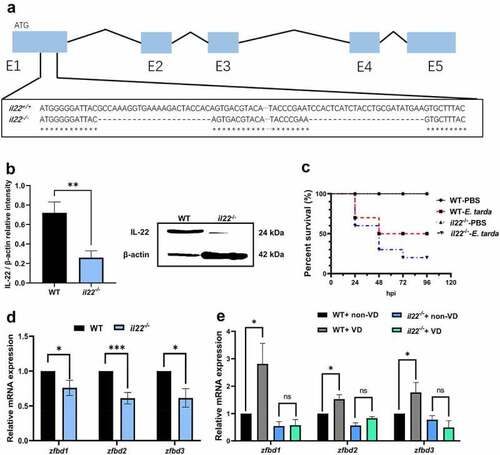
IL-22 mediated VD-induced β-defensin expression in zebrafish intestine. (a) The deletion site by CRISPR/Cas9 on the il22 gene exon (E)1 (exons are in blue boxes) was displayed. (b) The protein level of IL-22 in the intestine of WT and il22-/- zebrafish was compared (n = 6/group). The image is representative of 6 replicates. (c) Zebrafish at 3 mpf were i.p. injected with 107 CFU E. tarda or PBS, and the survival rate was recorded until 96 hours-post infection (n = 10/group). (d) The gene expression of zfbd1, zfbd2 and zfbd3 in zebrafish intestine was measured. (e) After WT and il22 mutant zebrafish at 2 mpf were fed with 0 or 800 IU/kg dietary VD3 for 4 weeks, the transcript levels of zfbd1, zfbd2 and zfbd3 in zebrafish intestine were evaluated (n = 6–8/group). *p < 0.05, ***p < 0.001, ns: non-significance. See also Figures S2. |

Microbiota was involved in VD-regulated intestinal immunity. (a) The proximal promoter of il22 (−2719 to + 506 bp) in zebrafish was amplified, and cloned into the luciferase reporter plasmid pGL3 as pGL3-il22. Meanwhile, pGL3 plasmid without il22 promoter was used as control. pGL3 or pGL3-il22 was microinjected into zebrafish embryos at one or two-cell stage, followed by the incubation with control buffer or 1,25(OH)2D3 (10 nM). After 24 h, the relative luciferase activity in zebrafish embryos was assessed (n = 6–9 replicates/group, 10–15 larvae/replicate). (b) The zebrafish at 3 mpf were treated with antibiotics mixture or control buffer for one week, and the gene expression of il22, zfbd1, zfbd2 and zfbd3 in zebrafish intestine was assessed (n = 8/group). (c) After the zebrafish were treated with antibiotics mixture for one week, they were conventionally raised for another week (CONVED group). The zebrafish in control group were conventionally raised for 2 weeks. The gene level of il22, zfbd1, zfbd2 and zfbd3 in zebrafish intestine was analyzed (n = 8/group). (d-e) WT and cyp2r1 mutant zebrafish were treated with or without antibiotics for 3 weeks, and the gene expression of il22, zfbd1, zfbd2, zfbd3 in the gut was analyzed (n = 8/group). (f-g) The gene expression of il22, zfbd1, zfbd2, zfbd3 in the gut of zebrafish fed with 0 or 800 IU/kg VD3 diets for 4 weeks with or without antibiotic treatment (n = 8/group). **p < 0.01, ***p < 0.001, ns: non-significance. See also Figures S3. |
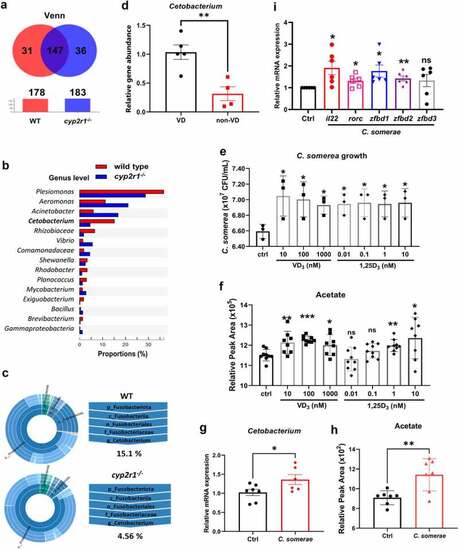
VD influenced the abundance of Cetobacterium spp. in gut microbiota of zebrafish. (a) Venn diagram of exclusive and shared OTUs-level phylotypes (at ⩾97% sequence identity) in WT and cyp2r1 mutant zebrafish (n = 4/genotype). (b) The relative abundance of gut microbiota at the genus level in WT and cyp2r1 mutant zebrafish was analyzed. (c) The pie chart from the inner circle to the outer circle visually exhibited the proportion and distribution of multi-level species in WT and cyp2r1-/- zebrafish at the phylum, class, order, family, and genus levels in turn (n = 4/genotype). (d) Intestinal microbial genomic DNA was extracted from zebrafish fed with 0 or 800 IU/kg VD3 diets for 4 weeks, the abundance of Cetobacterium spp. in the intestinal microbiota was further measured by qRT-PCR using specific primers for Cetobacterium spp. Meanwhile, gene copies of universal bacteria in zebrafish intestine were measured by using eubacteria primers for the normalization. (e-f) C. somerae was cultured in vitro for 8 hours in the presence of different concentrations of VD3 or 1,25(OH)2D3. The growth of C. somerae was calculated (e), and acetate concentrations in the cultures of C. somerae were measured by GC-MS. Results were calculated combined from 3 independent experiments (f). (g-i) Zebrafish at 3 mpf were treated by antibiotics mixture for one week, followed by rearing in the water with or without C. somerae (1 × 10⁵ CFU/ml) for another week. Thereafter, the abundance of Cetobacterium in gut (g), acetate concentration in serum (h), and the gene expression of il22, rorc, zfbd1, zfbd2, zfbd3 in gut (i) was analyzed (n = 6/group). *p < 0.05, **p < 0.01, ***p < 0.001. See also Figures S4. |
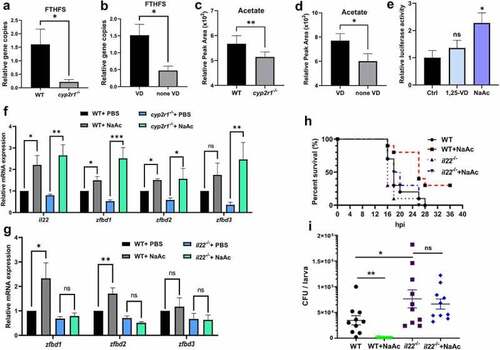
Acetate increased the intestinal antimicrobial responses. (a-b) Relative gene abundance of FTHFS was analyzed in WT and cyp2r1-/- zebrafish by qRT-PCR (n = 5–6/genotype) (a), and in WT zebrafish fed with 0 or 800 IU/kg VD3 for 4 weeks (n = 5–6/group) (b). Gene copies of total bacteria in zebrafish intestine were measured for the normalization by qRT-PCR using eubacteria primers (n = 5–6/genotype). (c-d) Furthermore, acetate levels in the serum of WT and cyp2r1-/- zebrafish (n = 4/genotype) (c) or WT zebrafish fed with 0 or 800 IU/kg VD3 for 4 weeks (n = 4/group) (d) was assessed. (e) The pGL3-il22 plasmid was microinjected into zebrafish embryos at one or two-cell stage. Subsequently, embryos were incubated with control buffer, 1,25(OH)2D3 (10 nM) or sodium acetate (NaAc, 30 mM) for 24 h, and the relative luciferase activity was assessed (n = 5–6 replicates/group, 10–15 larvae/replicate). (f) WT and cyp2r1 mutant zebrafish were injected with PBS or NaAc (1 μmol), and the gene expression of il22, zfbd1, zfbd2, zfbd3 in the gut was analyzed (n = 8/group). (g) WT and il22 mutant zebrafish were injected with PBS or NaAc (1 μmol), and the gene expression of zfbd1, zfbd2, zfbd3 in the gut was analyzed (n = 14/group). (h) WT and il22 mutant zebrafish larvae at 5 dpf were microinjected with E. tarda (approximately 200 bacteria/larva). The larvae survival in each group was recorded up to 36 hpi (n = 10 larvae/group). (i) Zebrafish larvae at 3 dpf were immersed with 1.5 × 10⁸ CFU/mL E. tarda. After 72 h, the bacterial load in larvae was counted (n = 20 larvae/group) (c). *p < 0.05, **p < 0.01, ***p < 0.001. See also Figures S5. |
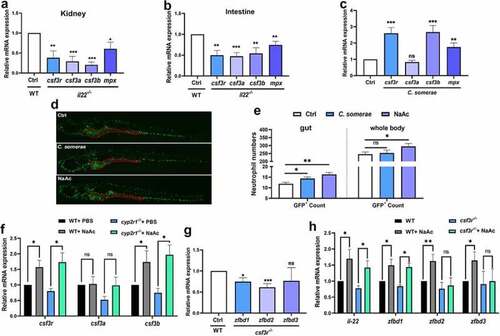
SCFAs enhanced the neutrophil immune responses. (a-b) Transcript levels of csf3r, csf3a, csf3b and mpx in the kidney (a) and intestine (b) of WT and il22 mutant zebrafish (n = 6/genotype) was measured. (c) The gene expression of csf3r, csf3a, csf3b and mpx in the gut of adult zebrafish treated with C. somerae for one week was analyzed (n = 6/group). (d-e) After Tg (mpx:egfp) zebrafish at 3 dpf were treated with control buffer, C. somerae (1 × 10⁵ CFU/mL) or NaAc (30 mM) for 3 days, the abundance and localization of GFP+ neutrophils was observed under Lionheart™ FX fluorescent microscope (BioTek). Red dashed line indicates the intestinal area in Tg (mpx:egfp) zebrafish (d). GFP+ cells in the intestine and in the whole body were counted by Gen5 v3.12 software (BioTek) (e). (f) WT and cyp2r1 mutant zebrafish were injected with PBS or NaAc (1 μmol), and the gene expression of csf3r, csf3a, csf3b in the gut was analyzed (n = 8/group). (g) The gene expression of zfbd1, zfbd2, zfbd3 in WT and csf3r-/- crispant zebrafish at 6 dpf was compared (n = 6 replicates/genotype, 8–15 larvae/replicate). (h) WT and csf3r-/- crispant zebrafish larvae at 2 dpf were treated with NaAc (30 mM) for 4 days. Afterwards, the gene expression of il22, zfbd1, zfbd2, zfbd3 in zebrafish larvae was measured (n = 8 replicates/group, 8–15 larvae/replicate). *p < 0.05, **p < 0.01, ***p < 0.001. See also Figures S6. |