
|
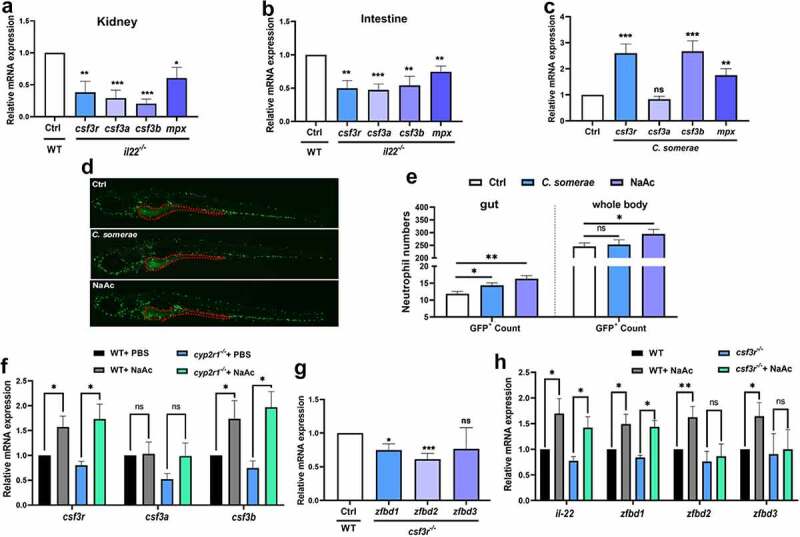
Figure 6.
SCFAs enhanced the neutrophil immune responses. (a-b) Transcript levels of csf3r, csf3a, csf3b and mpx in the kidney (a) and intestine (b) of WT and il22 mutant zebrafish (n = 6/genotype) was measured. (c) The gene expression of csf3r, csf3a, csf3b and mpx in the gut of adult zebrafish treated with C. somerae for one week was analyzed (n = 6/group). (d-e) After Tg (mpx:egfp) zebrafish at 3 dpf were treated with control buffer, C. somerae (1 × 10⁵ CFU/mL) or NaAc (30 mM) for 3 days, the abundance and localization of GFP+ neutrophils was observed under Lionheart™ FX fluorescent microscope (BioTek). Red dashed line indicates the intestinal area in Tg (mpx:egfp) zebrafish (d). GFP+ cells in the intestine and in the whole body were counted by Gen5 v3.12 software (BioTek) (e). (f) WT and cyp2r1 mutant zebrafish were injected with PBS or NaAc (1 μmol), and the gene expression of csf3r, csf3a, csf3b in the gut was analyzed (n = 8/group). (g) The gene expression of zfbd1, zfbd2, zfbd3 in WT and csf3r-/- crispant zebrafish at 6 dpf was compared (n = 6 replicates/genotype, 8–15 larvae/replicate). (h) WT and csf3r-/- crispant zebrafish larvae at 2 dpf were treated with NaAc (30 mM) for 4 days. Afterwards, the gene expression of il22, zfbd1, zfbd2, zfbd3 in zebrafish larvae was measured (n = 8 replicates/group, 8–15 larvae/replicate). *p < 0.05, **p < 0.01, ***p < 0.001. See also Figures S6.