
|
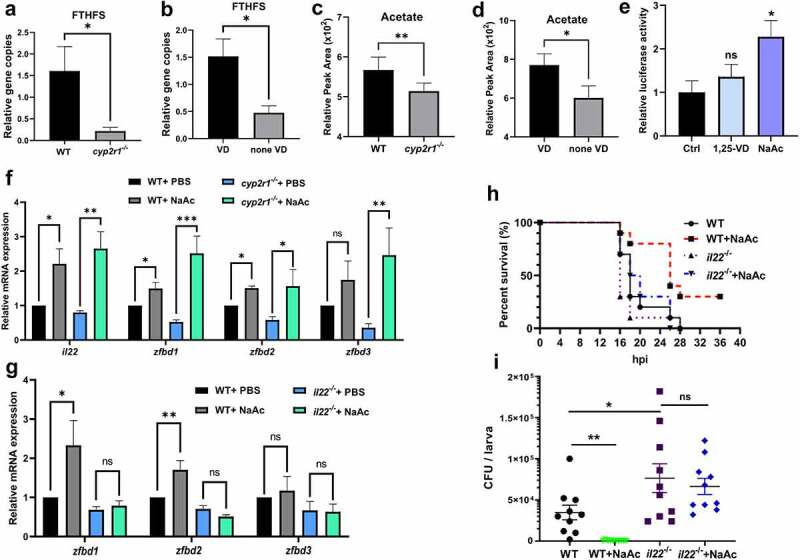
Figure 5.
Acetate increased the intestinal antimicrobial responses. (a-b) Relative gene abundance of FTHFS was analyzed in WT and cyp2r1-/- zebrafish by qRT-PCR (n = 5–6/genotype) (a), and in WT zebrafish fed with 0 or 800 IU/kg VD3 for 4 weeks (n = 5–6/group) (b). Gene copies of total bacteria in zebrafish intestine were measured for the normalization by qRT-PCR using eubacteria primers (n = 5–6/genotype). (c-d) Furthermore, acetate levels in the serum of WT and cyp2r1-/- zebrafish (n = 4/genotype) (c) or WT zebrafish fed with 0 or 800 IU/kg VD3 for 4 weeks (n = 4/group) (d) was assessed. (e) The pGL3-il22 plasmid was microinjected into zebrafish embryos at one or two-cell stage. Subsequently, embryos were incubated with control buffer, 1,25(OH)2D3 (10 nM) or sodium acetate (NaAc, 30 mM) for 24 h, and the relative luciferase activity was assessed (n = 5–6 replicates/group, 10–15 larvae/replicate). (f) WT and cyp2r1 mutant zebrafish were injected with PBS or NaAc (1 μmol), and the gene expression of il22, zfbd1, zfbd2, zfbd3 in the gut was analyzed (n = 8/group). (g) WT and il22 mutant zebrafish were injected with PBS or NaAc (1 μmol), and the gene expression of zfbd1, zfbd2, zfbd3 in the gut was analyzed (n = 14/group). (h) WT and il22 mutant zebrafish larvae at 5 dpf were microinjected with E. tarda (approximately 200 bacteria/larva). The larvae survival in each group was recorded up to 36 hpi (n = 10 larvae/group). (i) Zebrafish larvae at 3 dpf were immersed with 1.5 × 10⁸ CFU/mL E. tarda. After 72 h, the bacterial load in larvae was counted (n = 20 larvae/group) (c). *p < 0.05, **p < 0.01, ***p < 0.001. See also Figures S5.