
|
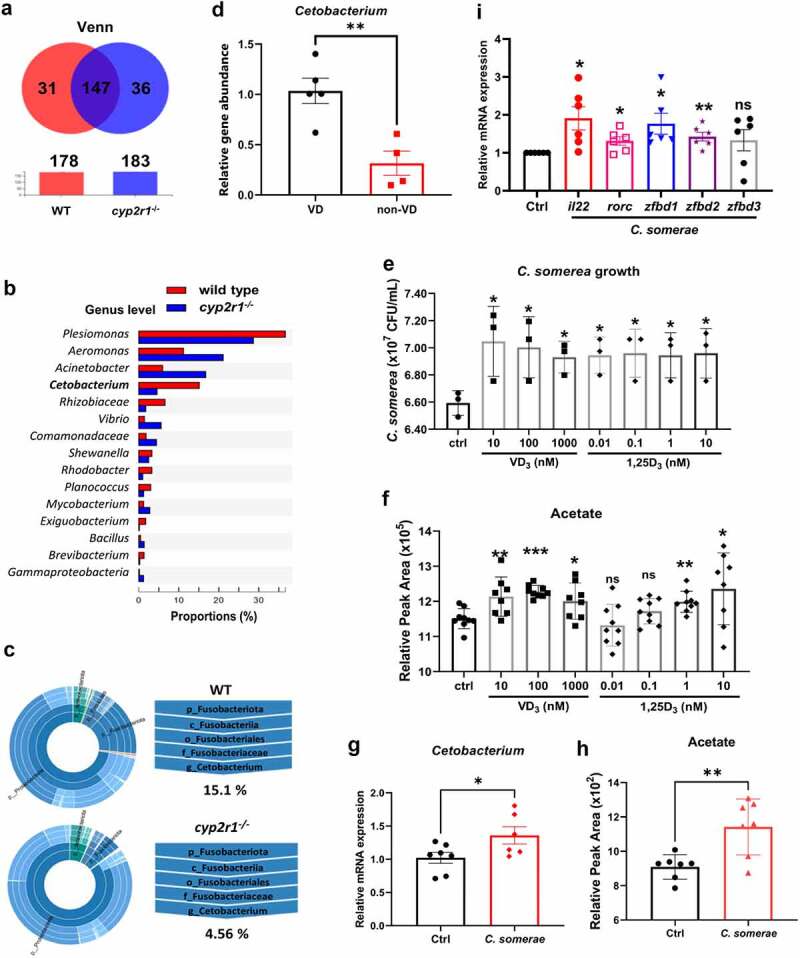
Figure 4.
VD influenced the abundance of Cetobacterium spp. in gut microbiota of zebrafish. (a) Venn diagram of exclusive and shared OTUs-level phylotypes (at ⩾97% sequence identity) in WT and cyp2r1 mutant zebrafish (n = 4/genotype). (b) The relative abundance of gut microbiota at the genus level in WT and cyp2r1 mutant zebrafish was analyzed. (c) The pie chart from the inner circle to the outer circle visually exhibited the proportion and distribution of multi-level species in WT and cyp2r1-/- zebrafish at the phylum, class, order, family, and genus levels in turn (n = 4/genotype). (d) Intestinal microbial genomic DNA was extracted from zebrafish fed with 0 or 800 IU/kg VD3 diets for 4 weeks, the abundance of Cetobacterium spp. in the intestinal microbiota was further measured by qRT-PCR using specific primers for Cetobacterium spp. Meanwhile, gene copies of universal bacteria in zebrafish intestine were measured by using eubacteria primers for the normalization. (e-f) C. somerae was cultured in vitro for 8 hours in the presence of different concentrations of VD3 or 1,25(OH)2D3. The growth of C. somerae was calculated (e), and acetate concentrations in the cultures of C. somerae were measured by GC-MS. Results were calculated combined from 3 independent experiments (f). (g-i) Zebrafish at 3 mpf were treated by antibiotics mixture for one week, followed by rearing in the water with or without C. somerae (1 × 10⁵ CFU/ml) for another week. Thereafter, the abundance of Cetobacterium in gut (g), acetate concentration in serum (h), and the gene expression of il22, rorc, zfbd1, zfbd2, zfbd3 in gut (i) was analyzed (n = 6/group). *p < 0.05, **p < 0.01, ***p < 0.001. See also Figures S4.