
- Title
-
Two Novel lncRNAs Regulate Primordial Germ Cell Development in Zebrafish
- Authors
- Li, W., Liu, W., Mo, C., Yi, M., Gui, J.
- Source
- Full text @ Cells

The top 25 genes and GO analysis of top 100 genes in the transcriptome of zebrafish PGCs. (A) Top 25 genes in the transcriptome. Arrows indicated the known PGC markers. (B) The most enriched biological process (left) and cellular components (right) of the top 100 genes in the transcriptome. |

Identification and characterization of lncRNAs in zebrafish PGCs. (A) A pie chart showing the lncRNAs and classification of novel lncRNAs. (B–D) The comparison of FPKM value (B), transcript length (C), and exon number (D) between lncRNAs and mRNAs. |

The regulation network of lncRNA-mRNA associated with PGC development. PGC development–associated genes are shown in the purple circles and their regulatory lncRNAs are shown in the grey triangles. |

qPCR analysis of top 8 lncRNAs in lncRNA-mRNA network. (A) Relative expression of vasa, dnd and selected lncRNAs in PGC and soma. (B–G) Tissue distribution and embryonic expression of lnc196 (B,E), lnc304 (C,F), and lnc172 (D,G). * p < 0.01, ** p < 0.01; *** p < 0.001 and **** p < 0.0001. |

Double color fluorescent analysis of lncRNAs and vasa protein in zebrafish testes. The signals of lnc196 (A), lnc304 (D), and lnc172 (G) are shown in green, and vasa signals (B,E,H) are indicated in red. (C,F,I) The merged images and magnified images are shown in the boxes within panel C and F. SG: spermatogonia, PSP: primary spermatocyte, SSP: secondary spermatocyte and SP: spermatid. Scale bar:10 μm. |
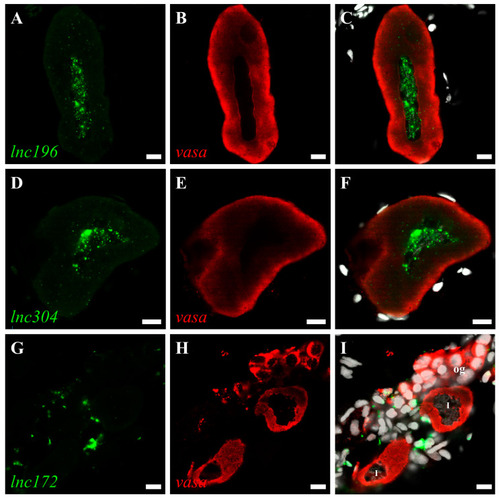
Double color fluorescent analysis of lncRNAs and vasa protein in zebrafish ovary. The signals of lncRNAs lnc196 (A), lnc304 (D) and lnc172 (G) and vasa signals (B,E,H) are shown in green and red, respectively. (C,F,I) Merged images. og: oogonia, I: stage I oocyte. Scale bar:10 μm. |

Loss- and gain-of lnc304 and lnc172 affected PGC development. (A) The fold change in endogenous lnc304 and lnc172 in embryos injected with lnc304 ASO gradients and lnc172 ASO gradients in comparison with embryo injected with control ASO (con ASO), respectively. (B–I) Representative images of the GFP-labelled PGCs in the embryos injected with con ASO (B), lnc304 ASO (C), lnc172 ASO (D), rfp (E), lnc304 (F), lnc172 (G), lnc304 + lnc304 ASO (H) and lnc172 + lnc172 ASO (I), respectively. Arrowheads indicate mislocalized PGCs. (J–M) The percentage of embryos with mislocalized PGC (J,L) and the number of mislocalized PGCs in each embryo (K,M) after injection of different RNAs and ASOs shown in (B–I) above. The columns represented for mean ± SD. Results were representative of more than three independent experiments in triplicate. ef1a and rpl13a were used as internal controls to normalize gene expression levels with 2-ΔΔCt method. * p < 0.05; ** p < 0.01; *** p < 0.001, **** p < 0.0001. Scale bar, 100 µm. |
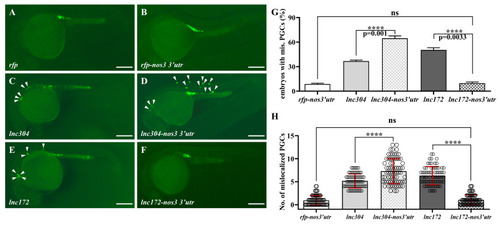
PGC-specific overexpression of lnc304 affected PGC development. (A–F) Representative images of the GFP-labelled PGCs in the embryos injected with rfp (A), rfp-nos3′utr (B), lnc304 RNA (C), lnc304-nos3 3′utr (D), lnc172 RNA (E) and lnc172-nos3 3′utr (F). Arrowheads indicate mislocalized PGCs. (G,H) The percentage of embryos with mislocalized PGC (G) and the number of mislocalized PGCs (H) in each embryo after injection of different RNAs in (A–F). (H) The columns represented for mean ± SD. The results were representative of more than three independent experiments in triplicate. **** p < 0.0001. Scale bar, 100 µm. |