
Image
|
Figure Caption
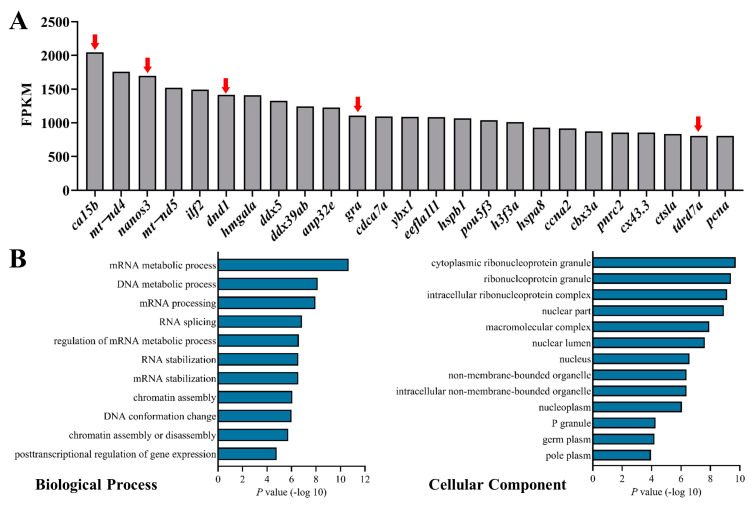
Figure 1
The top 25 genes and GO analysis of top 100 genes in the transcriptome of zebrafish PGCs. (A) Top 25 genes in the transcriptome. Arrows indicated the known PGC markers. (B) The most enriched biological process (left) and cellular components (right) of the top 100 genes in the transcriptome.
Acknowledgments
This image is the copyrighted work of the attributed author or publisher, and
ZFIN has permission only to display this image to its users.
Additional permissions should be obtained from the applicable author or publisher of the image.
Full text @ Cells