
Image
|
Figure Caption
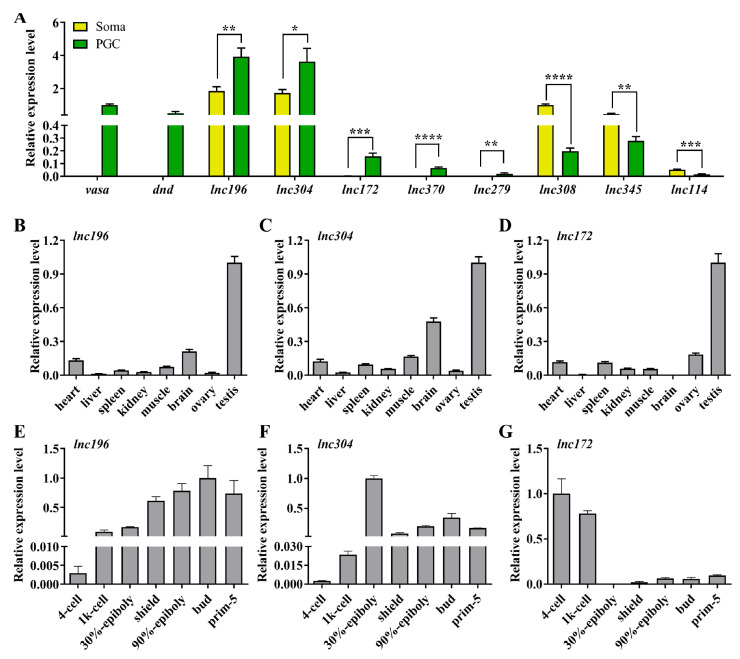
Figure 4
qPCR analysis of top 8 lncRNAs in lncRNA-mRNA network. (A) Relative expression of vasa, dnd and selected lncRNAs in PGC and soma. (B–G) Tissue distribution and embryonic expression of lnc196 (B,E), lnc304 (C,F), and lnc172 (D,G). * p < 0.01, ** p < 0.01; *** p < 0.001 and **** p < 0.0001.
Acknowledgments
This image is the copyrighted work of the attributed author or publisher, and
ZFIN has permission only to display this image to its users.
Additional permissions should be obtained from the applicable author or publisher of the image.
Full text @ Cells