
|
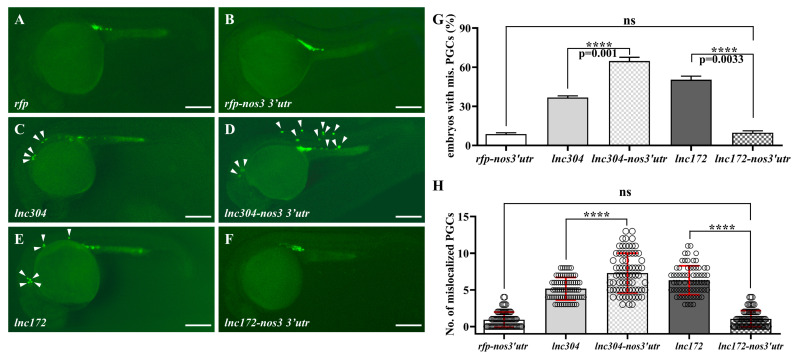
Figure 8
PGC-specific overexpression of lnc304 affected PGC development. (A–F) Representative images of the GFP-labelled PGCs in the embryos injected with rfp (A), rfp-nos3′utr (B), lnc304 RNA (C), lnc304-nos3 3′utr (D), lnc172 RNA (E) and lnc172-nos3 3′utr (F). Arrowheads indicate mislocalized PGCs. (G,H) The percentage of embryos with mislocalized PGC (G) and the number of mislocalized PGCs (H) in each embryo after injection of different RNAs in (A–F). (H) The columns represented for mean ± SD. The results were representative of more than three independent experiments in triplicate. **** p < 0.0001. Scale bar, 100 µm.