
- Title
-
AgRP Neuron-Specific Ablation Represses Appetite, Energy Intake, and Somatic Growth in Larval Zebrafish
- Authors
- Lin, C.Y., Yeh, K.Y., Lai, H.H., Her, G.M.
- Source
- Full text @ Biomedicines
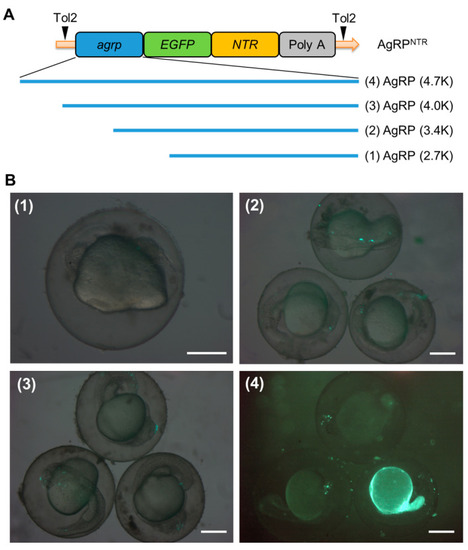
Transient expression analysis of the agrp-enhanced, green, fluorescent protein-nitroreductase (agrp-EGFP-NTR) deletion constructs. (A) Schematic diagram of the DNA construct used to generate AgRPNTR (Tg[agrp-EGFP-NTR]) transgenic zebrafish. AgRP (4.7K)-EGFP-NTR contains a 4749 bp 5′ flanking region of the agrp gene, and EGFP-NTR fusion has an in-frame 24 bp region downstream of the agrp translational start site. (B) Each deletion construct was generated as described in Section 2.2 for functional analyses of the promoter. A total of 4.6 nL (15 ng/µL) of the deletion constructs for (1) AgRP (2.7K)-EGFP-NTR, (2) AgRP (3.4K)-EGFP-NTR, and (3) AgRP (4.0K)-EGFP-NTR and the full-length construct for (4) AgRP (4.7K)-EGFP-NTR were microinjected into one-cell stage embryos. EGFP signal was observed in 36 h post-fertilization (hpf) embryos injected with these constructs via fluorescence microscopy. Scale bar: 200 µm. |
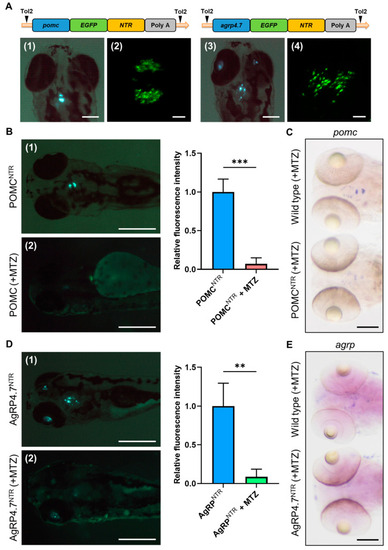
Establishment of POMCNTR and AgRP4.7NTR transgenic fish and neuron ablation tests. (A) Schematic diagram of the DNA construct used to generate POMCNTR and AgRP4.7NTR transgenic zebrafish lines. Fluorescence images of (1) POMCNTR and (3) AgRP4.7NTR larval head at 5 days post-fertilization (dpf) (Scale bar: 200 µm). Confocal images of (2) pro-opiomelanocortin (POMC) neurons of POMCNTR and (4) AgRP neurons of AgRP4.7NTR at 5 dpf (Scale bar: 20 µm). (B) Left: Fluorescence images of (1) POMCNTR transgenic zebrafish larvae at 5 dpf and (2) metronidazole (MTZ)-treated POMCNTR transgenic zebrafish larvae at 5 dpf, n = 3. Scale bar: 500 µm. Right: quantification diagram of fluorescence intensity. All values are the mean ± standard error of the mean (SEM), n = 30. *** p < 0.001. (C) Whole mount in situ hybridization (WISH) assays showing the expression signals of pomc transcripts in POMC neurons in wild-type (WT) and POMCNTR larvae at 5 dpf, n = 30. Scale bar: 100 µm. (D) Left: Fluorescence images of (1) AgRP4.7NTR transgenic zebrafish larvae at 5 dpf and (2) MTZ-treated AgRP4.7NTR transgenic zebrafish larvae at 5 dpf, n = 3. Scale bar: 500 µm. Right: quantification diagram of fluorescence intensity. All values reported as mean ± SEM, n = 30. ** p < 0.01. (E) WISH assay results showing the expression signals of agrp transcripts in AgRP neurons in WT and AgRP4.7NTR larvae at 5 dpf. Scale bar: 100 µm. |

The sequence and potential response elements in the 4.7 kb agrp promoter of zebrafish. The nucleotide sequence was downloaded from the Ensembl website “https://asia.ensembl.org/Danio_rerio/Info/Index" (accessed on 2 May 2022). (A) The translational start codon (ATG) is underlined and shown as position +1. Nucleotides are numbered on the right, starting with the translational codon. Potential binding motifs in the proximal region are also marked. (B) Sequences of the putative agrp regulatory element. The predicted binding motif within a distal region of agrp promoter. Potential binding motifs are marked. (C) Hypothetical model of agrp transcription activation in zebrafish. The proteins shown in the figure are: TATA-box-binding protein (Tbp), CCAAT/enhancer-binding protein alpha (Cebpα), ISL LIM homeobox 1 (Isl1), Kruppel-like factor 4 (Klf4), nuclear receptor subfamily 3 group C member 1 (Nr3c1), forkhead box O1 (Foxo1), GATA-binding protein 1 (Gata1), T cell acute lymphocytic leukemia 1 (Tal1), and brain-specific homeobox (Bsx). |

Blind test experiment of targeted neuron ablation transgenic fish. (A) Lateral views of POMCNTR, WT, and AgRP4.7NTR six-week-old larvae. (B) Survival rate of each group. (C) Statistical analysis of body length (jaw to caudal fin) in six-week-old POMCNTR, WT, and AgRP4.7NTR larvae. Data are shown as box plots including median (line), interquartile range (box), and 95% confidence interval (whiskers). *** p < 0.001. |

Qualitative food intake assay for MTZ-treated WT and AgRP4.7NTR larvae. (A) Side views of 8 dpf larvae were observed under fluorescence lighting. MTZ-treated WT and AgRP4.7NTR larvae were cultivated with 4-Di-10-ASP-labeled paramecia for 1 h before observing the fluorescent contents in their guts. Scale bar: 2 mm. (B) Relationship between the relative amount of paramecia and fluorescence intensities of ingested paramecia in zebrafish. All values are represented as the mean ± SEM, n = 50. *** p < 0.001. |
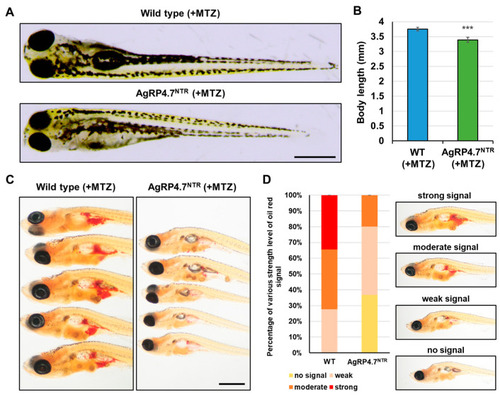
AgRP neuron ablation results in the inhibition of somatic growth and adipocyte formation. (A) Lateral view of MTZ-treated WT and AgRP4.7NTR larvae at 8 dpf. Scale bar: 500 µm. (B) Statistics of body length measurement between MTZ-treated WT and AgRP4.7NTR larvae at 8 dpf. All values are reported as mean ± SEM, n = 30. *** p < 0.001. (C) Lipid droplet accumulation was observed via whole-body Oil Red O staining of MTZ-treated WT and AgRP4.7NTR larvae at 21 dpf. Scale bar: 1 mm. (D) Left: Distribution of lipid droplets in MTZ-treated WT and AgRP4.7NTR larvae at 21 dpf, n = 30. Right: Intensity grading diagram. |
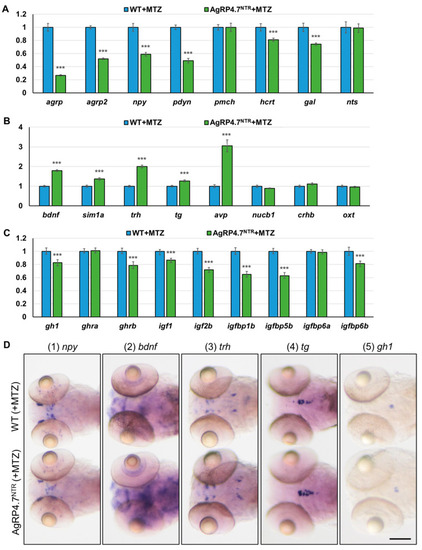
Effects of AgRP ablation on appetite and growth regulation in the brain of zebrafish. Real-time RT-qPCR analysis was used to measure the mRNA expression levels of (A) orexigenic genes (agrp, agrp2, npy, pdyn, pro-melanin concentrating hormone (pmch), hcrt, gal, and neurotensin (nts)); (B) anorexigenic genes (bdnf, sim1a, trh, tg, avp, nucleobindin 1 (nucb1), corticotropin releasing hormone b (crhb), and oxytocin (oxt)); and (C) GH/IGF axis genes (gh1, ghra, ghrb, igf1, igf2b, igfbp1b, igfbp5b, igfbp6a, and igfbp6b) in MTZ-treated WT and AgRP4.7NTR larvae at 8 dpf, n = 30. Values are represented as the mean ± S.E.M. *** p < 0.001. (D) WISH experiment revealed the expression levels and patterns of npy, bdnf, trh, tg, and gh1 in the brains of MTZ-treated WT and AgRP4.7NTR larvae at 5 dpf, n = 30. Scale bars = 100 µm. |
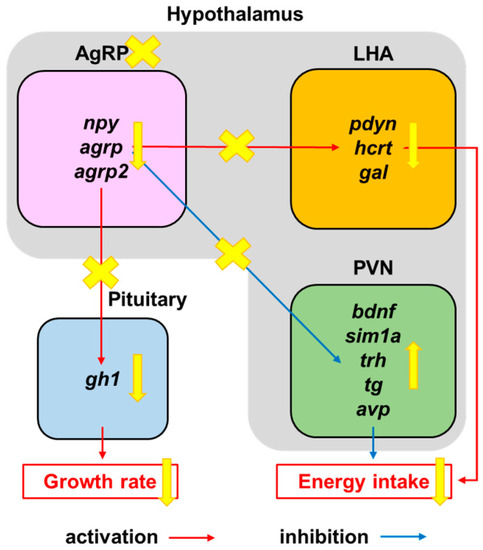
Appetite-regulation pathway under AgRP neuron ablation. Schematic diagram of suppression of orexigenic factors (pdyn, hcrt, and gal) within the lateral hypothalamus area (LHA) and promotion of anorexigenic factors (bdnf, sim1a, trh, tg, and avp) within the paraventricular nucleus (PVN) via AgRP neuron ablation, leading to appetite and growth suppression. |