
|
Figure 2
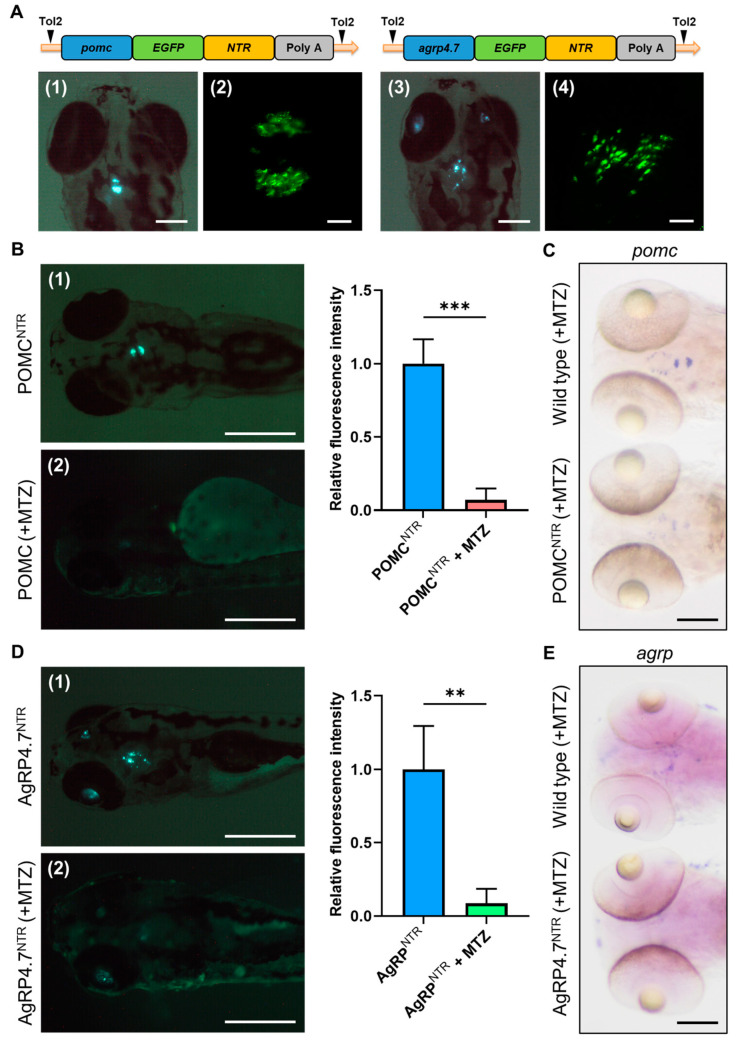
Establishment of POMCNTR and AgRP4.7NTR transgenic fish and neuron ablation tests. (A) Schematic diagram of the DNA construct used to generate POMCNTR and AgRP4.7NTR transgenic zebrafish lines. Fluorescence images of (1) POMCNTR and (3) AgRP4.7NTR larval head at 5 days post-fertilization (dpf) (Scale bar: 200 µm). Confocal images of (2) pro-opiomelanocortin (POMC) neurons of POMCNTR and (4) AgRP neurons of AgRP4.7NTR at 5 dpf (Scale bar: 20 µm). (B) Left: Fluorescence images of (1) POMCNTR transgenic zebrafish larvae at 5 dpf and (2) metronidazole (MTZ)-treated POMCNTR transgenic zebrafish larvae at 5 dpf, n = 3. Scale bar: 500 µm. Right: quantification diagram of fluorescence intensity. All values are the mean ± standard error of the mean (SEM), n = 30. *** p < 0.001. (C) Whole mount in situ hybridization (WISH) assays showing the expression signals of pomc transcripts in POMC neurons in wild-type (WT) and POMCNTR larvae at 5 dpf, n = 30. Scale bar: 100 µm. (D) Left: Fluorescence images of (1) AgRP4.7NTR transgenic zebrafish larvae at 5 dpf and (2) MTZ-treated AgRP4.7NTR transgenic zebrafish larvae at 5 dpf, n = 3. Scale bar: 500 µm. Right: quantification diagram of fluorescence intensity. All values reported as mean ± SEM, n = 30. ** p < 0.01. (E) WISH assay results showing the expression signals of agrp transcripts in AgRP neurons in WT and AgRP4.7NTR larvae at 5 dpf. Scale bar: 100 µm.