
- Title
-
Expression of the Z Variant of α1-Antitrypsin Suppresses Hepatic Cholesterol Biosynthesis in Transgenic Zebrafish
- Authors
- Fung, C., Wilding, B., Schittenhelm, R.B., Bryson-Richardson, R.J., Bird, P.I.
- Source
- Full text @ Int. J. Mol. Sci.
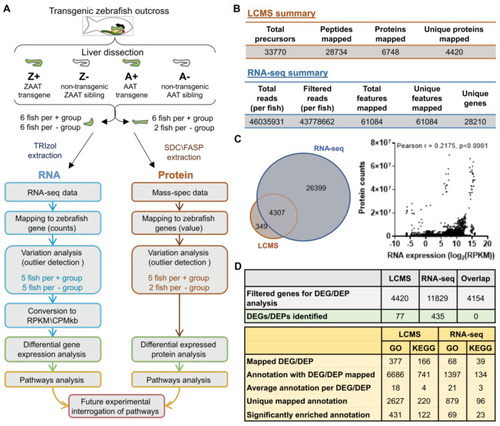
Overview of the global transcriptomic/proteomic approach to identify dysregulated pathways in ZAAT-expressing zebrafish livers. (A) Six fish in each genotype group were analysed, with protein and RNA samples extracted from each liver sample. Fish identified as outliers were excluded from subsequent analysis (see Supplementary Figure S2). (B) Summary statistics of LC-MS/MS and RNA-seq data aligned to the reference library or genome. (C) Comparison of libraries generated from RNA-seq and LC-MS/MS data (left panel). Correlation analysis of transcriptomic and proteomic expression profiles (right panel). Each point represents protein (counts) and RNA (log2CPM/kb) expression data from one gene in one fish. (Pearson r, r = 0.2157, p < 0.0001). (D) Summary statistics of differential expression analysis (top panel) and pathway enrichment analysis (bottom panel). |
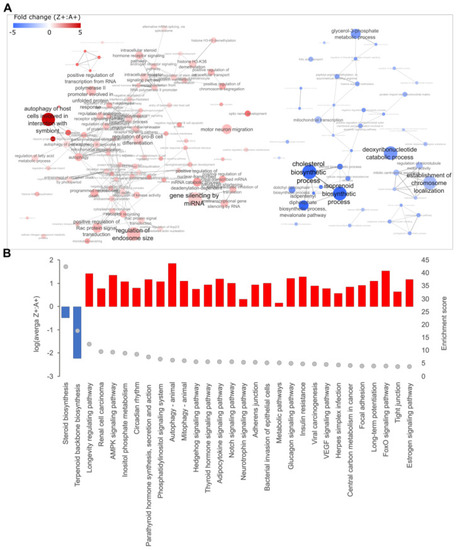
Pathway enrichment analysis of DEGs identified from RNA-seq data. Differentially expressed genes (DEGs) from RNA-seq data were mapped to the corresponding human orthologs and (A) Gene Ontology (GO) enrichment analysis was performed. The enriched GO annotations under the ‘Biological Process’ category were filtered based on an enrichment threshold >4 with annotations containing DEGs that are either all up- or down-regulated. Filtered annotations were then mapped onto an interaction network as nodes and were connected by an edge if there were common DEGs present between nodes. The thickness of the edge correlates to the number of common DEGs shared between two nodes. The size of each node represents the enrichment score from the GO enrichment analysis. Red indicates the up-regulation of the GO term while blue indicates downregulation. (B) The top 30 results from KEGG enrichment analysis. The histogram shows the direction and average level of dysregulation for all DEGs mapped to each KEGG pathway (left y-axis), and the grey dots indicate enrichment levels (right y-axis). |
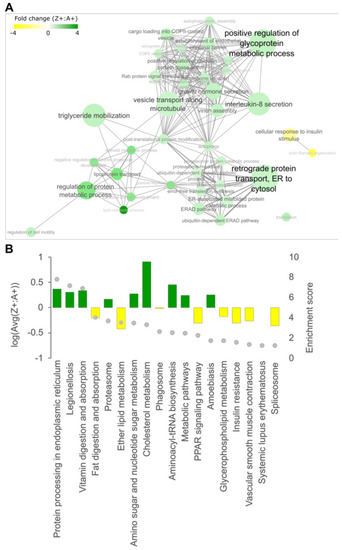
Pathway enrichment analysis of DEPs identified from LC-MS/MS data. Differentially expressed proteins (DEPs) from LC-MS/MS data were mapped to the corresponding human orthologs and (A) Gene Ontology (GO) enrichment analysis was performed. The enriched GO annotations under the ‘Biological Process’ category were filtered for annotations containing DEPs that are either all up- or down-regulated. Filtered annotations were then mapped onto an interaction network as nodes and were connected by an edge if there are common DEPs present between nodes. The thickness of the edge correlates to the number of common DEPs shared between two nodes. The size of each node represents the enrichment score from the GO enrichment analysis. Green indicates the up-regulation of the GO term while yellow indicates downregulation. (B) KEGG enrichment analysis of DEPs. The histogram shows the direction and average level of dysregulation for all DEPs mapped to each KEGG pathway (left y-axis), and the grey dots indicate enrichment levels (right y-axis). |
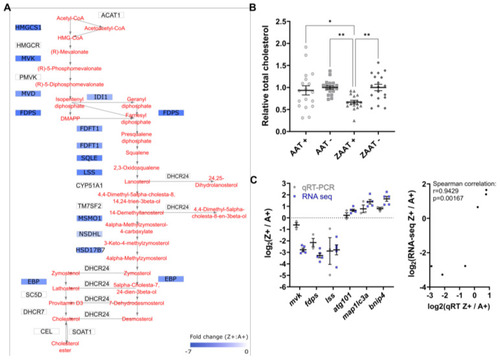
Cholesterol biosynthesis is suppressed in ZAAT-expressing zebrafish liver. (A) Mapping of DEGs onto KEGG pathways suggests downregulation of cholesterol biosynthesis (modified from pathways hsa00900 and hsa00100). (B) Total cholesterol was measured in adult zebrafish livers. A total of 18 fish from each genotype, pooled from 5 independent experiments, were used for analysis. Every single point represents the average of two technical replicate measurements for each animal. One-way ANOVA was used to determine statistical significance. Error bars indicate mean ± s.e.m. * p < 0.05, ** p < 0.01. (C) Validation of RNA-seq by qPCR. Expression profiles of six DEGs from RNA-seq and qPCR data were compared (left panel). qPCR expression values were normalised to the housekeeping genes rpl13a and lsm12b. Correlation analysis of RNA-seq and qPCR (right panel), Spearman’s rho, rs = 0.9429, p = 0.00167. |

Expression of ZAAT in HepG2 cells suppresses SREBP2 target genes. (A) Transgenes used for HepG2 transfection (top panel). Immunoblot of HepG2 cell lysates for eGFP as an indication of transgene expression levels using β-tubulin as a loading control (bottom panel). qPCR analysis was performed from cDNA generated from HepG2 cells with stable overexpression of (B) eGFP-T2A-ZAAT and (C) eGFP-T2A-AAT. Expression values were normalised to the housekeeping genes GAPDH, ACTB and TBP. An unpaired student’s t-test was used to determine the statistical significance for each gene. Error bars indicate mean ± s.e.m. * p < 0.05, *** p < 0.001. |
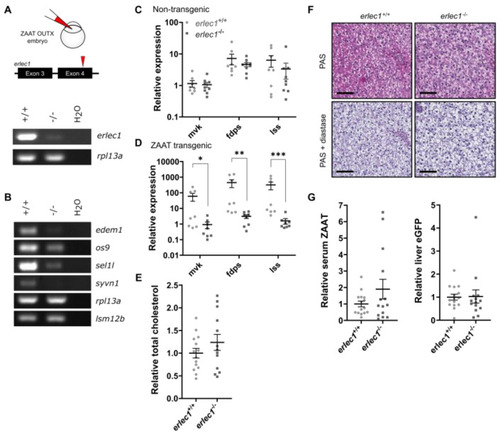
Erlec1 ablation further suppresses cholesterol biosynthesis in ZAAT-expressing zebrafish liver. (A) gRNA targeting exon 4 was injected into embryos from the Tg(lfabp: eGFP-T2A-ZAAT) line at the one-cell stage. RT-PCR for erlec1 used cDNA made from 1 µg RNA extracted from pooled whole embryos at 7 dpf. The housekeeping gene rpl13a was used as a loading control. (B) RT-PCR of genes encoding components of Hrd1 E3 ligase complex using cDNA made from 1 µg RNA extracted from adult zebrafish liver. The housekeeping genes rpl13a and lsm12b were used as loading controls. qPCR analysis of representative cholesterol biosynthesis DEGs in adult (C) non-transgenic zebrafish livers, as well as (D) livers expressing ZAAT, using data pooled from two independent experiments. Expression values were normalised to the housekeeping genes fabp10a, rpl13a, and lsm12b. Error bars indicate mean ± s.e.m. Unpaired student’s t-test and Mann-Whitney U test were used to detect statistical significance for each gene. * p < 0.05, ** p < 0.01, *** p < 0.001. (E) Total cholesterol was measured in adult ZAAT-expressing livers (erlec1+/+, n = 14, erlec1−/−, n = 13). Every single point represents the average of two technical replicate measurements for each animal. Student’s t-test was performed and indicated no significant difference in levels from wildtype and erlec1−/− fish. (F) Periodic acid-Schiff (PAS) staining with and without diastase was performed on 3 µm thick paraffin zebrafish liver sections. The scale bar represents 50 µm. (G) The ratio of antitrypsin to IgM (left panel) and eGFP to total protein (right panel) in zebrafish blood was detected by immunoblot (see Supplementary Figure S10) and quantitated by densitometry. Shown are the pooled data from four independent experiments, with each point representing an individual fish. Student’s t-test was performed and indicated no significant difference between levels in wildtype and erlec1−/− fish. |
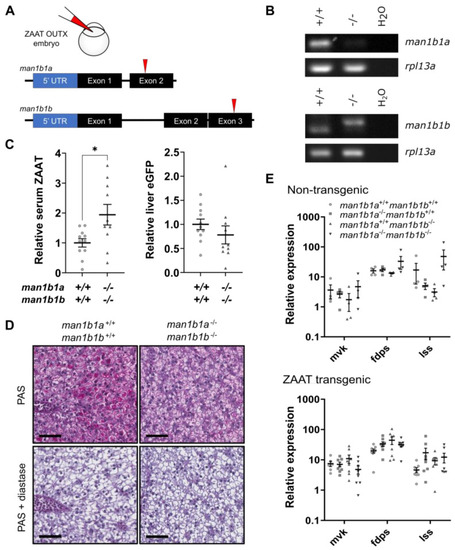
Man1b1 ablation enhances ZAAT secretion without affecting retention in hepatocytes. (A) Two gRNA targeting exon 2 of man1b1a or exon 3 of man1b1b were co-injected into outcross embryos from the Tg(lfabp: eGFP-T2A-ZAAT) line at the one-cell stage. (B) RT-PCR of man1b1a (top panel) and man1b1b (bottom panel) using cDNA made from 1 µg RNA extracted from pooled whole embryos at 7 dpf. The housekeeping gene rpl13a was used as a loading control. (C) The ratio of antitrypsin to IgM (left panel) and eGFP to total protein (right panel) in zebrafish blood was detected by immunoblot (Supplementary Figure S17) and quantitated by densitometry. Shown are the pooled data from three independent experiments, with each point representing an individual fish. Statistical significance was determined by Unpaired Student’s t-test. * p < 0.05. (D) Periodic acid-Schiff (PAS) staining with and without diastase was performed on 3 µm thick paraffin zebrafish liver sections. The scale bar represents 50 µm. (E) qPCR analysis of representative cholesterol biosynthesis DEGs in adult non-transgenic zebrafish livers (top panel), as well as livers expressing ZAAT (bottom panel), using data pooled from two independent experiments. Expression values were normalised to the housekeeping genes rpl13a and lsm12b. One-way ANOVA was performed and indicated no significant difference between levels from the four genotypes for each gene. |
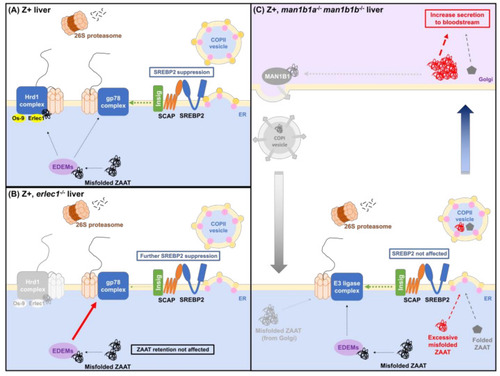
Model for ERAD pathway interference between the ZAAT processing system and cholesterol biosynthesis. (A) In zebrafish expressing ZAAT, degradation of misfolded ZAAT via ERAD-L limits the ERAD machinery available for Insig turnover via ERAD-M. More Insig, therefore, remains bound to the Scap-Srebp2 complex in the ER membrane, reducing Srebp2 release from the ER and suppressing activation of the downstream cholesterol biosynthesis pathway. (B) Ablation of Erlec1 prevents the retrotranslocation of misfolded ZAAT via the Hrd1 ligase complex and redirects it to the gp78 complex, further reducing the capacity for Insig degradation and enhancing Srebp2 retention in the ER membrane. (C) The absence of Man1b1 proteins in zebrafish liver enhances ZAAT secretion, consistent with a role for Man1b1 in the Golgi in retrieving misfolded ZAAT that escaped the ERQC system and returning it to the ER. |