
Figure 3
- ID
- ZDB-IMAGE-230217-25
- Publication
- Fung et al., 2023 - Expression of the Z Variant of α1-Antitrypsin Suppresses Hepatic Cholesterol Biosynthesis in Transgenic Zebrafish
- All Figures
- Figures for Fung et al., 2023
|
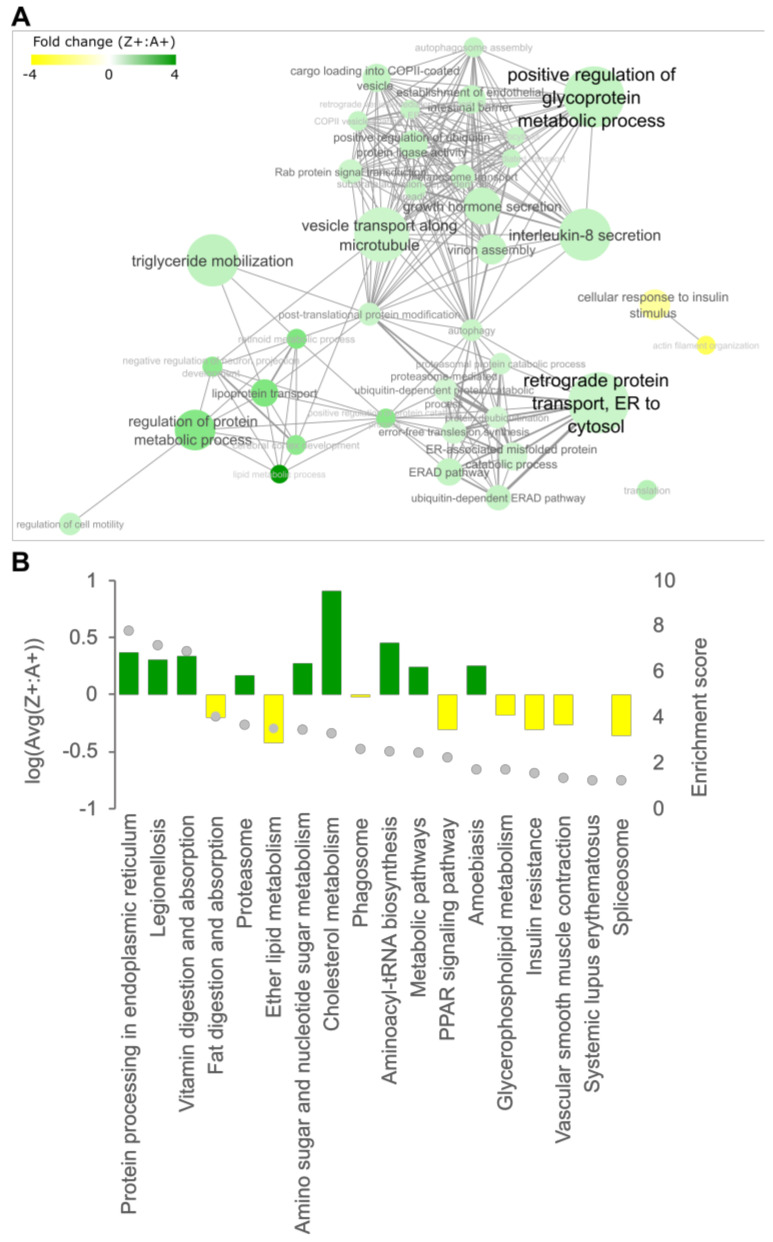
Figure 3
Pathway enrichment analysis of DEPs identified from LC-MS/MS data. Differentially expressed proteins (DEPs) from LC-MS/MS data were mapped to the corresponding human orthologs and (A) Gene Ontology (GO) enrichment analysis was performed. The enriched GO annotations under the ‘Biological Process’ category were filtered for annotations containing DEPs that are either all up- or down-regulated. Filtered annotations were then mapped onto an interaction network as nodes and were connected by an edge if there are common DEPs present between nodes. The thickness of the edge correlates to the number of common DEPs shared between two nodes. The size of each node represents the enrichment score from the GO enrichment analysis. Green indicates the up-regulation of the GO term while yellow indicates downregulation. (B) KEGG enrichment analysis of DEPs. The histogram shows the direction and average level of dysregulation for all DEPs mapped to each KEGG pathway (left y-axis), and the grey dots indicate enrichment levels (right y-axis).