
Figure 6
- ID
- ZDB-FIG-230217-15
- Publication
- Fung et al., 2023 - Expression of the Z Variant of α1-Antitrypsin Suppresses Hepatic Cholesterol Biosynthesis in Transgenic Zebrafish
- Other Figures
- All Figure Page
- Back to All Figure Page
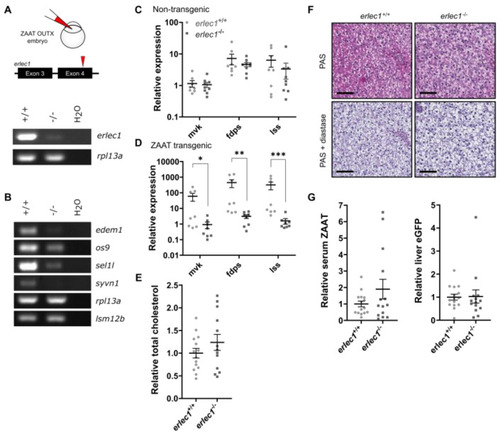
Erlec1 ablation further suppresses cholesterol biosynthesis in ZAAT-expressing zebrafish liver. (A) gRNA targeting exon 4 was injected into embryos from the Tg(lfabp: eGFP-T2A-ZAAT) line at the one-cell stage. RT-PCR for erlec1 used cDNA made from 1 µg RNA extracted from pooled whole embryos at 7 dpf. The housekeeping gene rpl13a was used as a loading control. (B) RT-PCR of genes encoding components of Hrd1 E3 ligase complex using cDNA made from 1 µg RNA extracted from adult zebrafish liver. The housekeeping genes rpl13a and lsm12b were used as loading controls. qPCR analysis of representative cholesterol biosynthesis DEGs in adult (C) non-transgenic zebrafish livers, as well as (D) livers expressing ZAAT, using data pooled from two independent experiments. Expression values were normalised to the housekeeping genes fabp10a, rpl13a, and lsm12b. Error bars indicate mean ± s.e.m. Unpaired student’s t-test and Mann-Whitney U test were used to detect statistical significance for each gene. * p < 0.05, ** p < 0.01, *** p < 0.001. (E) Total cholesterol was measured in adult ZAAT-expressing livers (erlec1+/+, n = 14, erlec1−/−, n = 13). Every single point represents the average of two technical replicate measurements for each animal. Student’s t-test was performed and indicated no significant difference in levels from wildtype and erlec1−/− fish. (F) Periodic acid-Schiff (PAS) staining with and without diastase was performed on 3 µm thick paraffin zebrafish liver sections. The scale bar represents 50 µm. (G) The ratio of antitrypsin to IgM (left panel) and eGFP to total protein (right panel) in zebrafish blood was detected by immunoblot (see Supplementary Figure S10) and quantitated by densitometry. Shown are the pooled data from four independent experiments, with each point representing an individual fish. Student’s t-test was performed and indicated no significant difference between levels in wildtype and erlec1−/− fish. |