
- Title
-
Novel Zebrafish Patient-Derived Tumor Xenograft Methodology for Evaluating Efficacy of Immune-Stimulating BCG Therapy in Urinary Bladder Cancer
- Authors
- Kowald, S., Huge, Y., Tandiono, D., Ali, Z., Vazquez-Rodriguez, G., Erkstam, A., Fahlgren, A., Sherif, A., Cao, Y., Jensen, L.D.
- Source
- Full text @ Cells
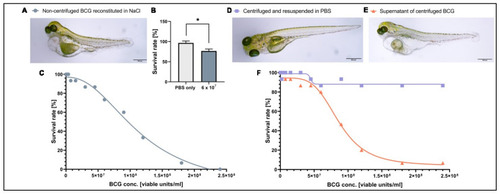
Toxicity of BCG-Medac is caused by a soluble component of the powder. (A) Light micrograph image of 5-day-old zebrafish larvae three days after having received a subcutaneous injection of ~3 nL of completely reconstituted BCG-Medac. (B) Quantification of larval survival at 5 days post-fertilization, three days after subcutaneous injection of ~3 nL of completely reconstituted BCG-Medac, or only PBS (vehicle). (C) Graph showing the proportion of larvae that survived at 5 days post-fertilization, three days after injection with the indicated concentrations of 3 nL of completely reconstituted BCG-Medac. (D,E) Light micrograph images of 5-day-old zebrafish larvae three days after having received a subcutaneous injection of ~3 nL of pelleted and re-suspended bacteria (D) or supernatant (E) from the reconstituted BCG-Medac powder. (F) Graph showing the proportion of larvae that survived at 5 days post-fertilization, three days after injection with ~3 nL of pelleted, and re-suspended bacteria (blue line) or supernatant (orange line) from the reconstituted BCG-Medac powder. n = 15 embryos per group. *: p < 0.05. |
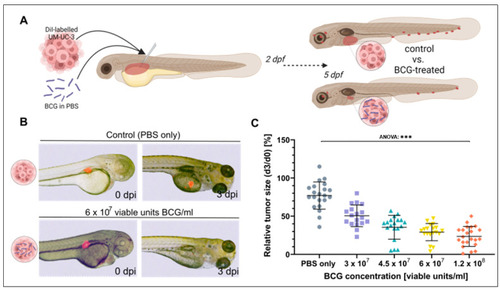
Tumor size regression of UM-UC-3 tumors is observed in zebrafish xenografts after three days of BCG treatment. (A) Cartoon illustrating the experimental setup. DiI labelled UM-UC-3 tumor cells mixed with BCG were subcutaneously microinjected into zebrafish larvae 2 days post-fertilization and primary tumor size was monitored until 3 days post injection (dpi). (B) Combined light- and fluorescence micrographs of 2-day-old zebrafish larvae implanted with fluorescently labelled primary tumors of control (UM-UC-3 + PBS) and BCG at 0 days post injection (dpi) and 3 dpi. (C): Graph showing the relative tumor size of control and BCG-co-injected larvae for 4 different concentrations of BCG-Medac. n = 24 injected embryos per group; *** = p < 0.0001. |
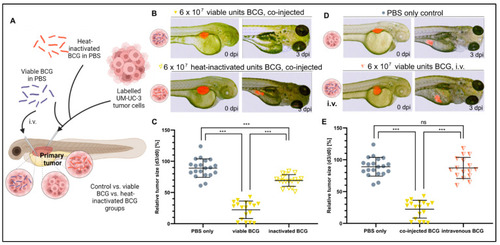
Heat inactivation and intravenous injection of BCG minimize the tumor-killing effect of BCG in UM-UC-3 xenografts. (A) Cartoon illustrating the experimental setup. Fluorescently labelled UM-UC-3 tumor cells alone or mixed with either viable (blue) or heat-inactivated (red) BCG were injected into the PVS of 2-day-old zebrafish larvae; alternatively, viable BCG was injected intravenously in subcutaneous tumor-bearing larvae. (B) Combined light and fluorescence micrographs at 0 days post injection (dpi) or 3 dpi of fluorescently labelled UM-UC-3 primary tumors mixed with either viable or head-inactivated BCG-Medac and implanted in 2-day-old zebrafish. (C) Graph showing the relative tumor size of control and BCG-co-injected larvae from the experiment shown in B. n = 24 injected embryos per group; ns = not significant; *** = p < 0.0001. (D) Combined light and fluorescence micrographs at 0 days post injection (dpi) or 3 dpi of fluorescently labelled UM-UC-3 primary tumors with or without intravenous BCG treatment. (E): Graph showing the relative tumor size of control, BCG co-injected, and BCG intravenously injected larvae from the experiment shown in D. n = 24 injected embryos per group; ns = not significant; *** = p < 0.0001. |
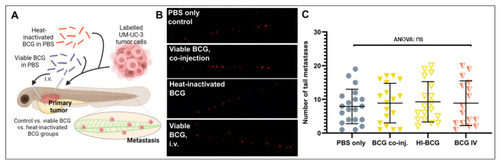
Tumor dissemination is not significantly impacted by BCG treatment of zebrafish UM-UC-3 tumor xenografts. (A) Cartoon showing the outline of the experiment. Fluorescently labelled UM-UC-3 tumor cells alone or mixed with viable or heat-inactivated BCG were injected into the PVS of 48 h old zebrafish larvae. Alternatively, viable BCG was injected intravenously in subcutaneous tumor-bearing larvae. (B) Fluorescent micrographs of the caudal hematopoietic plexus of control and BCG- (co-)injected tumor-bearing larva at 3 days post-implantation. Red dots represent disseminated tumor cells. (C) Graph showing the quantified number of cells present in the caudal hematopoietic plexus in the different treatment groups. n = 24 injected embryos per group; ns = not significant. |
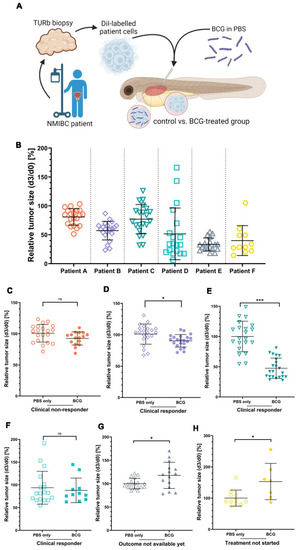
The clinical responses of three NMIBC patients are mirrored by the BCG treatment response of ZTX models. (A) Cartoon illustrating the experimental set-up. Cryo-preserved patient tumor tissues were dissociated, fluorescently labelled, and subcutaneously injected into the PVS of 48 h old zebrafish larvae with or without BCG. (B) Graph showing the relative tumor size of the six different ZTX models without BCG treatment quantified at 3 days post-injection (dpi). (C–H) Graphs comparing relative tumor sizes of BCG co-injected and untreated control ZTX groups quantified at 3 dpi. n = 20 injected embryos per group; ns = not significant; * = p < 0.05; *** = p < 0.0001. |