
|
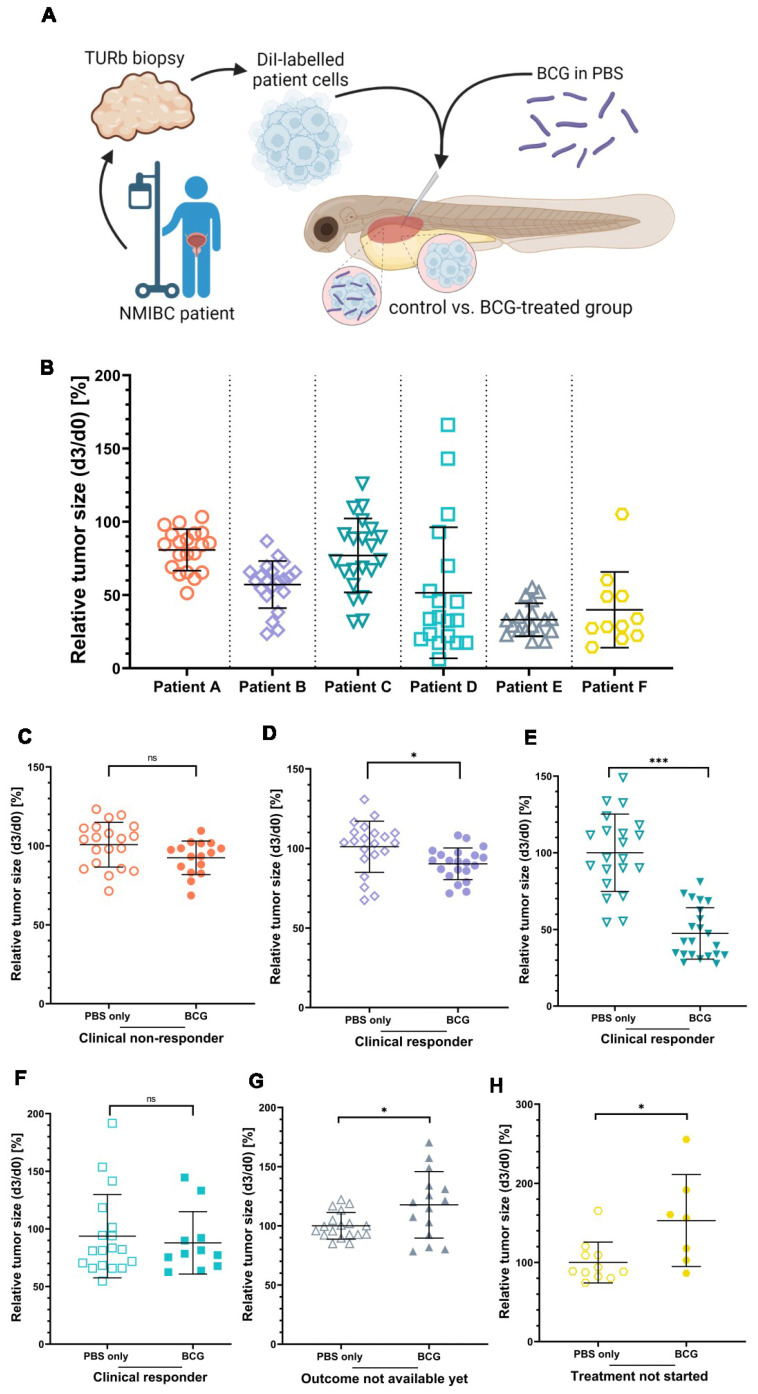
Figure 5
The clinical responses of three NMIBC patients are mirrored by the BCG treatment response of ZTX models. (A) Cartoon illustrating the experimental set-up. Cryo-preserved patient tumor tissues were dissociated, fluorescently labelled, and subcutaneously injected into the PVS of 48 h old zebrafish larvae with or without BCG. (B) Graph showing the relative tumor size of the six different ZTX models without BCG treatment quantified at 3 days post-injection (dpi). (C–H) Graphs comparing relative tumor sizes of BCG co-injected and untreated control ZTX groups quantified at 3 dpi. n = 20 injected embryos per group; ns = not significant; * = p < 0.05; *** = p < 0.0001.