
|
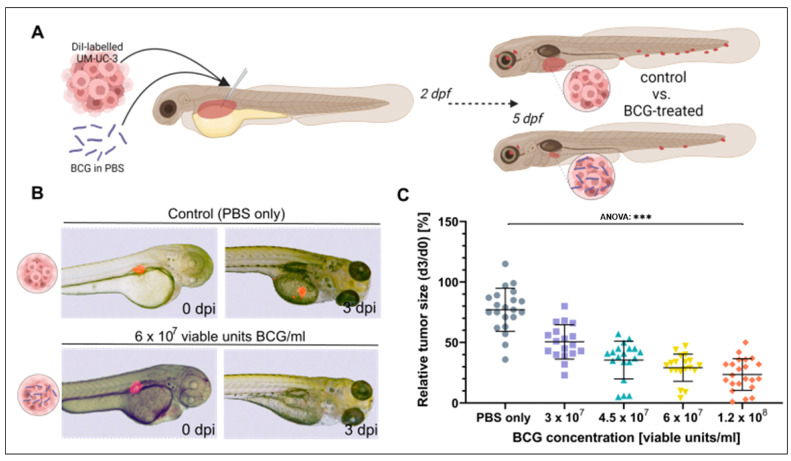
Figure 2
Tumor size regression of UM-UC-3 tumors is observed in zebrafish xenografts after three days of BCG treatment. (A) Cartoon illustrating the experimental setup. DiI labelled UM-UC-3 tumor cells mixed with BCG were subcutaneously microinjected into zebrafish larvae 2 days post-fertilization and primary tumor size was monitored until 3 days post injection (dpi). (B) Combined light- and fluorescence micrographs of 2-day-old zebrafish larvae implanted with fluorescently labelled primary tumors of control (UM-UC-3 + PBS) and BCG at 0 days post injection (dpi) and 3 dpi. (C): Graph showing the relative tumor size of control and BCG-co-injected larvae for 4 different concentrations of BCG-Medac. n = 24 injected embryos per group; *** = p < 0.0001.