
|
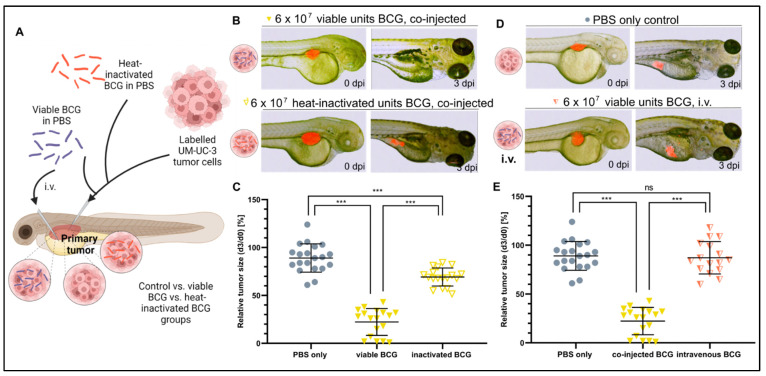
Figure 3
Heat inactivation and intravenous injection of BCG minimize the tumor-killing effect of BCG in UM-UC-3 xenografts. (A) Cartoon illustrating the experimental setup. Fluorescently labelled UM-UC-3 tumor cells alone or mixed with either viable (blue) or heat-inactivated (red) BCG were injected into the PVS of 2-day-old zebrafish larvae; alternatively, viable BCG was injected intravenously in subcutaneous tumor-bearing larvae. (B) Combined light and fluorescence micrographs at 0 days post injection (dpi) or 3 dpi of fluorescently labelled UM-UC-3 primary tumors mixed with either viable or head-inactivated BCG-Medac and implanted in 2-day-old zebrafish. (C) Graph showing the relative tumor size of control and BCG-co-injected larvae from the experiment shown in B. n = 24 injected embryos per group; ns = not significant; *** = p < 0.0001. (D) Combined light and fluorescence micrographs at 0 days post injection (dpi) or 3 dpi of fluorescently labelled UM-UC-3 primary tumors with or without intravenous BCG treatment. (E): Graph showing the relative tumor size of control, BCG co-injected, and BCG intravenously injected larvae from the experiment shown in D. n = 24 injected embryos per group; ns = not significant; *** = p < 0.0001.