
- Title
-
Increasing the field-of-view in oblique plane microscopy via optical tiling
- Authors
- Chen, B., Chang, B.J., Zhou, F.Y., Daetwyler, S., Sapoznik, E., Nanes, B.A., Terrazas, I., Gihana, G.M., Castro, L.P., Chan, I.S., Conacci-Sorrell, M., Dean, K.M., Millett-Sikking, A., York, A.G., Fiolka, R.
- Source
- Full text @ Biomed. Opt. Express
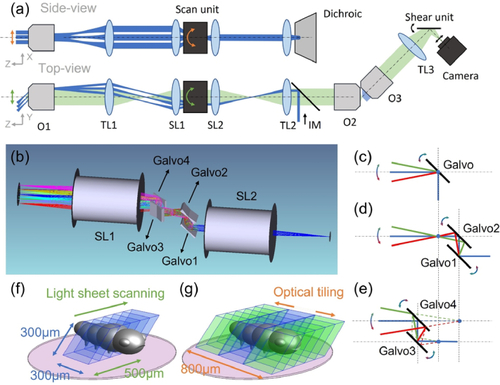
(a) Schematic drawing of the OPM system with optical tiling. O1-3, objectives; TL1-3, Tube Lenses; SL1-2, Scan Lenses, IM, Illumination Module. (b) Rendering of the optical layout of the dual-axis scan unit and scan lenses. (c)-(e) Working principle of a single-galvo, dual-galvo and quad-galvo scan unit. (f) Image volume covered by conventional OPM (blue volume). (g) Image volume covered by optical tiling OPM (blue and green volumes). The pink circle depicts the field of view of the primary objective. |
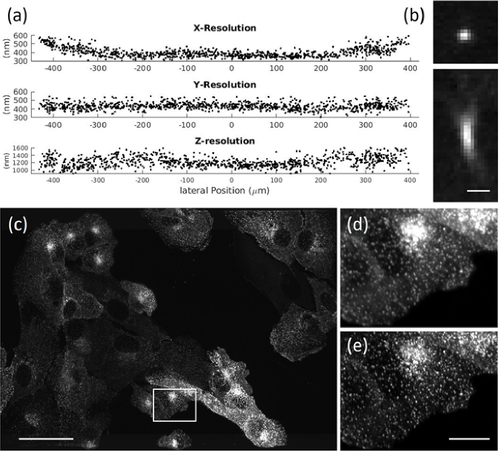
(a) Full Width Half Maximum measurements of fluorescent nanospheres over the whole FOV. (b) Representative point-spread function of a fluorescent nanosphere. (c) Maximum intensity projection of parental human retinal pigmented epithelium (ARPE-19) cells EGFP-labeled for AP2. (d) Raw data for box in (c). (e) Deconvolved data for box in (c). Scale bars: (b)1 µm; (c) 50 µm; (e) 10 µm. |
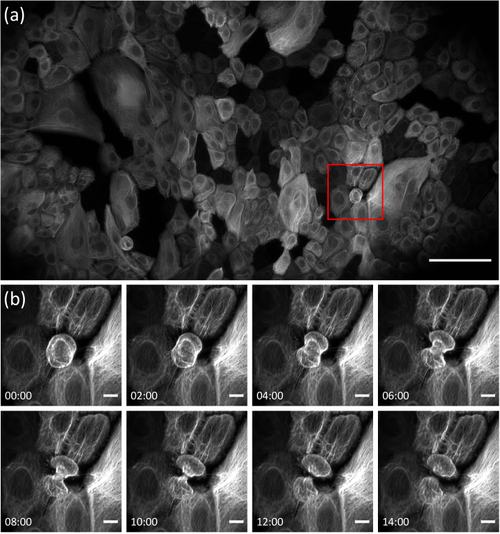
Imaging of the intermediate filament cytoskeleton in a monolayer of cultured keratinocytes expressing keratin 5 (K5)-mNeonGreen. (a) Maximum intensity projection of the tiled volume. A gamma correction of 0.7 has been applied. (b) Zoom on the red boxed region in (a), demonstrating profound rearrangement of the intermediate filament network during cell division. Scale bars: (a) 100 µm, (b) 10 µm. Timestamp: mm: ss. |
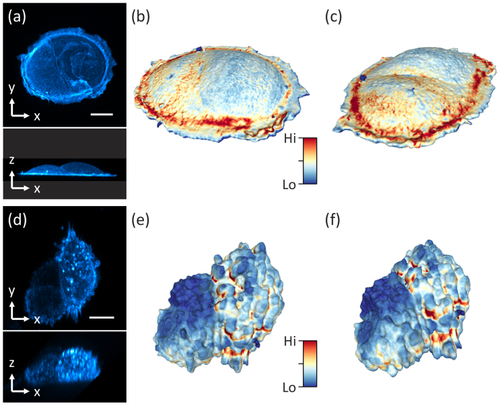
Imaging of single cells and spheroids. (a) Maximum intensity projection (MIP) of a SU8686 cell in xy and xz. (b-c) 3D rendering of the cell surface from two different views. Color encodes surface intensity. (d) MIPs of a Colon cancer cell spheroid in xy and xz. (e-f) 3D rendering of the surface from two different views. Scale bars: (a) 20 µm, (d) 10 µm. |
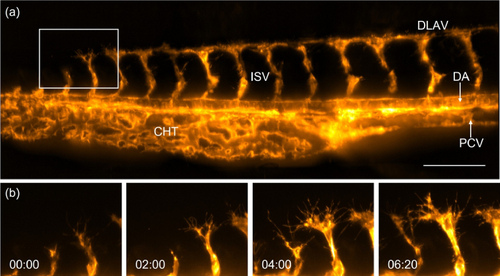
Imaging of zebrafish vasculature with optical tiling OPM. (a) Tail of a 1-2 d old Zebrafish labeled with Tg(kdrl:Hsa.HRAS-mCherry), as imaged by optical tiling OPM. A maximum intensity projection of three volumes that have been computationally stitched together is shown. DLAV, Dorsal longitudinal anastomotic vessel; DA, Dorsal aorta; PCV, Posterior cardinal vein; ISV, Intersegmental blood vessel; CHT, caudal hematopoietic tissue. (b) Enlarged views of the boxed region in (a) show the development of intersegmental vessels in the zebrafish tail. Scale bar: 100 µm. Timestamp: hh:mm. |
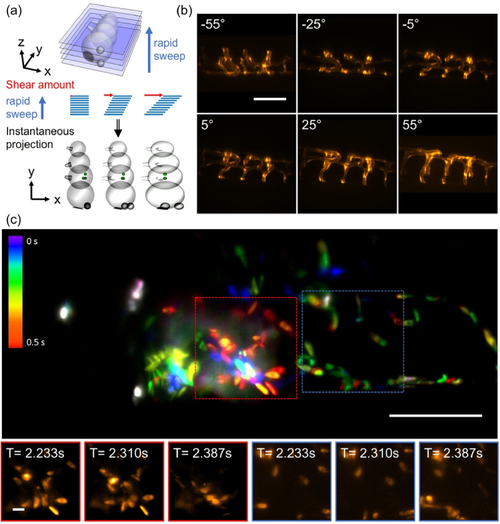
Extending the field of view in real time projection imaging. (a) Schematic representation of the projection method: the light-sheet is rapidly swept through the sample, and the instantaneous images are translated at the same rate on the camera sensor. Depending on the amount of lateral translation, projections under different viewing angle are obtained. (b) Projections of vasculature in the zebrafish tail under different viewing angles. (c) Tiled projection imaging of fluorescently labeled blood cells in a zebrafish heart. Insets show a montage of blood cells at different timepoints. Scale bars: (b-c) 100 µm and insets 10 µm. |
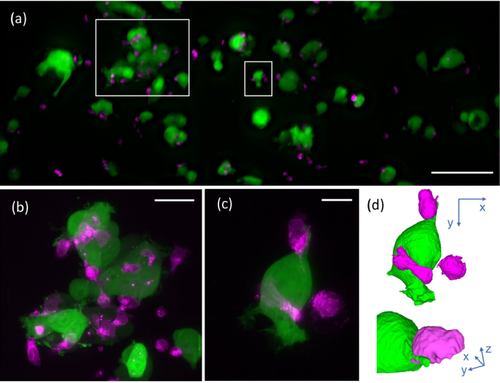
Hybrid tiled projection and targeted 3D imaging. (a) Last frame of series of tiled projection images of NK cells labeled with CellTracker red (shown in magenta) and MCF7 breast cancer cells cytosolically labeled with GFP (shown in green). (b) Projection of a 3D stack acquired around the large white rectangle in (a). (c) Projection of a 3D volume acquired around the small white rectangle in (a). (d) Rendering of the cell shown in (c). Scale bars: (a) 100 µm, (b) 30 µm, (c) 10µm. |