
- Title
-
Screening of Q-markers for the wine-steamed Schisandra chinensis decoction pieces in improving allergic asthma
- Authors
- Qu, Z., Bing, Y., Zhang, T., Zheng, Y., Wu, S., Ji, C., Li, W., Zou, X.
- Source
- Full text @ Chin. Med.

Graphical abstract for the entire study |
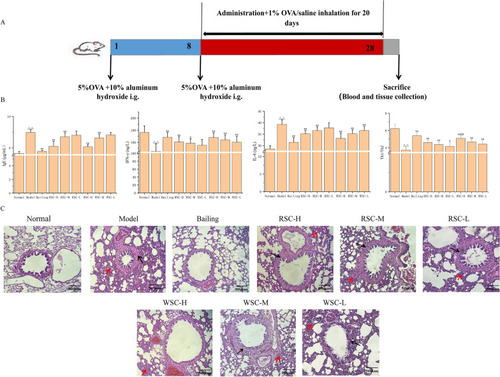
Amelioration effects of RSC and WSC on allergic asthmatic rats. A Establishment of the allergic asthma model. B Effects of the RSC and WSC decoctions on biochemical indices related to allergic asthma of treatment groups. The data are expressed as the mean ± SD (n = 10). Normal, normal group; Model, model group; Bailing, positive drug group; RSC-H, group treated with a high RSC dose; RSC-M, group treated with a medium RSC dose; RSC-L: group treated with a low RSC dose; WSC-H, group treated with a high WSC dose; WSC-M, WSC group treated with a medium WSC dose; WSC-L, group treated with a low RSC dose. △p < 0.05 and △△p < 0.01 vs. normal group, *p < 0.05 and **p < 0.01 vs. model group, #p < 0.05 and ##p < 0.01 vs. WSC-H group. C Effects of the RSC and WSC decoctions on the lung histomorphology (red arrows indicate inflammatory infiltration, and black arrows indicate bronchial wall thickening; H&E × 40) |
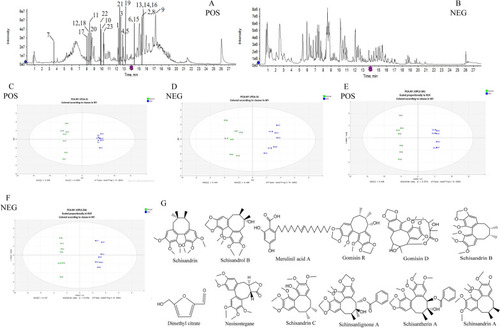
Identification of pharmacologically active components in the serum of the WSC-H group. A Total ion chromatogram of serum samples from the WSC-H group obtained in positive-ion mode. B Total ion chromatogram of serum samples from the WSC-H group obtained in negative-ion mode. The analysis conditions are detailed in the text, and the compounds labeled in the figure are listed in Table 1. C PCA diagram of the rat serum profile obtained in positive-ion mode. D PCA diagram of the rat serum profile obtained in negative-ion mode. E OPLS-DA diagram of the rat serum profile obtained in positive-ion mode. F OPLS-DA diagram of the rat serum profile obtained in negative-ion mode. G The structural formulas of the potentially bioactive compounds in serum |
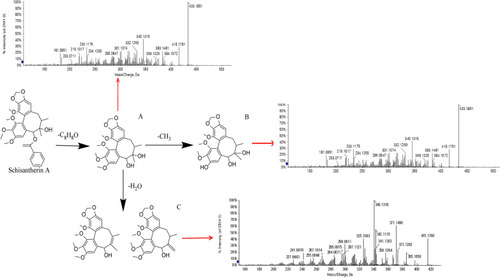
The proposed metabolic pathways of schisantherin A in serum. A The ion fragment of 6-debenzoyl-Schisantherin A. B The ion fragment of 3-demethylation-6-debenzoyl-Schisantherin A. C The ion fragment of 7,8-dehydration-6-debenzoyl-Schisantherin A or 7,17-dehydration-6-debenzoyl-Schisantherin A |
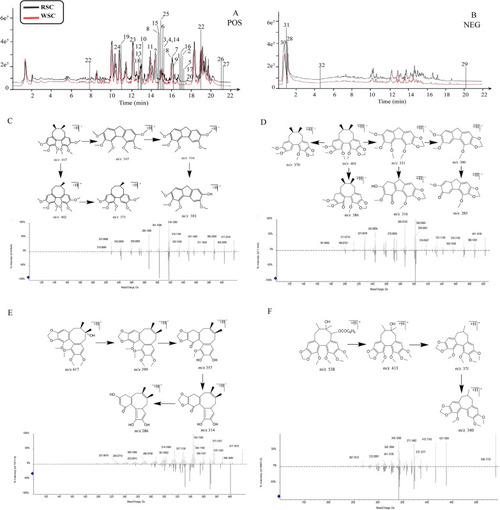
Comparison of chemical profiles of RSC and WSC. |
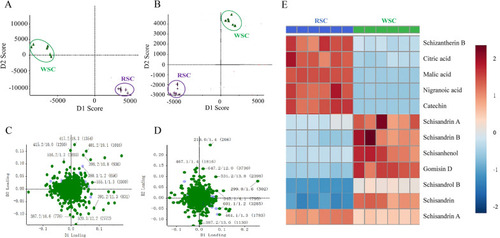
PCA of the RSC and WSC decoction pieces. A PCA score plot of the data for the RSC and WSC decoction pieces obtained in positive-ion mode. The data for the WSC decoction pieces were clearly separated from the data for the RSC decoction pieces. B PCA score plot of data for the RSC and WSC decoction pieces obtained in negative-ion mode. C S-plot for data of the RSC and WSC decoction pieces obtained in positive-ion mode. D S-plot for data of the RSC and WSC decoction pieces obtained in negative-ion mode. E Differences between the dissolution rates of the chemical components of RSC and WSC. The darker the red color is, the higher the dissolution rates are, and the darker the blue color is, the lower the dissolution rates are |
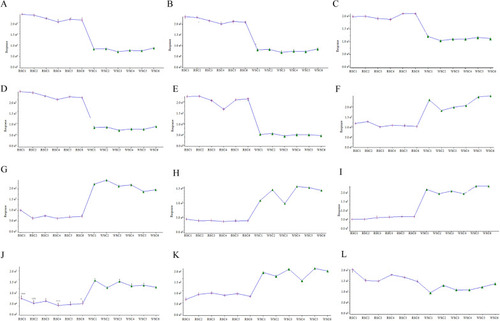
Contents of 12 ingredients in RSC before and after wine steaming. A Schizantherin B. |
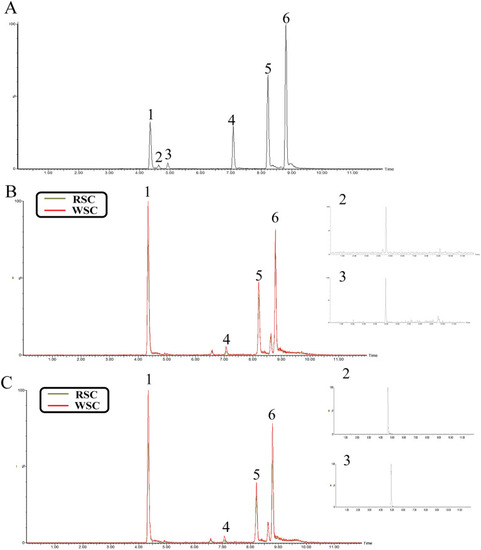
Total ion current diagrams for RSC and WSC obtained using MRM. A Reference mixture. B Superposition diagram of the total ion currents of RSC and WSC decoctions. C Superposition diagram of the total ion currents of methanol extracts of RSC and WSC (1. Schisandrin; 2. Gomisin D; 3. Schisandriol B; 4. Schisanhenol; 5. Schisandrin A; 6. Schisandrin B) |
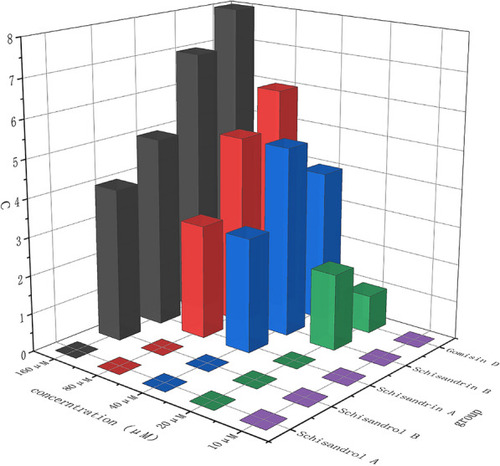
MTC of Schisandrin, Schisandrol B, Schisandrin A, Schisandrin B, and Gomisin D in zebrafish |
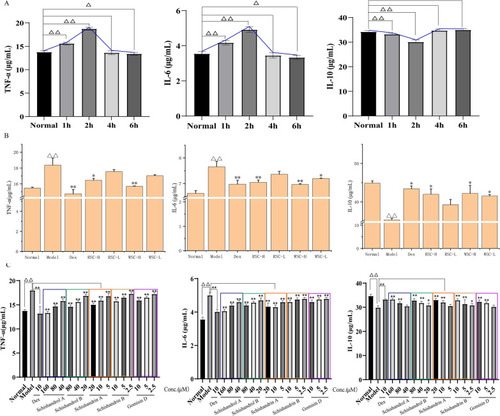
Efficacy validation based on the zebrafish inflammatory model. A Screening of the optimal time points. B Effects of RSC and WSC on the expression of TNF-α, IL-6, and IL-10. C Effects of five Q-markers on the expression of TNF-α, IL-6, and IL-10. The data are expressed as the mean ± SD (n = 10). △p < 0.05 and △△p < 0.01 vs. normal group, *p < 0.05 and **p < 0.01 vs. model group |