
|
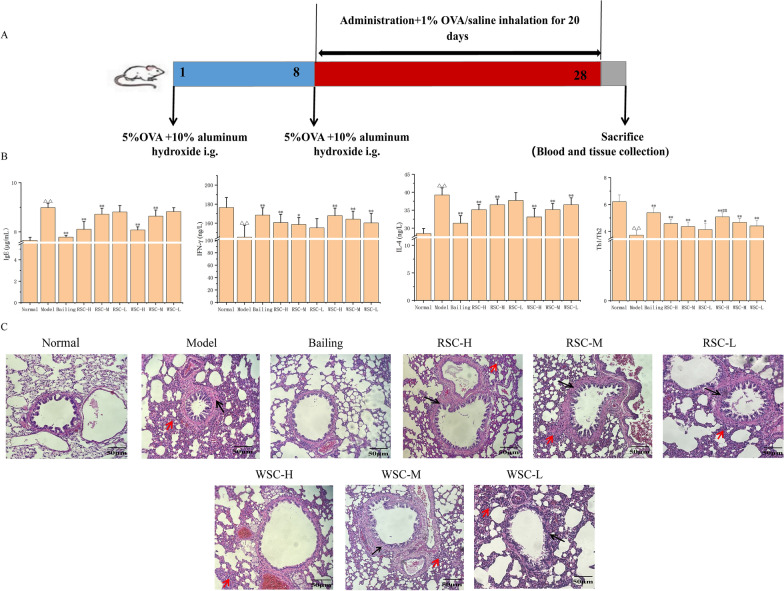
Fig. 2
Amelioration effects of RSC and WSC on allergic asthmatic rats. A Establishment of the allergic asthma model. B Effects of the RSC and WSC decoctions on biochemical indices related to allergic asthma of treatment groups. The data are expressed as the mean ± SD (n = 10). Normal, normal group; Model, model group; Bailing, positive drug group; RSC-H, group treated with a high RSC dose; RSC-M, group treated with a medium RSC dose; RSC-L: group treated with a low RSC dose; WSC-H, group treated with a high WSC dose; WSC-M, WSC group treated with a medium WSC dose; WSC-L, group treated with a low RSC dose. △p < 0.05 and △△p < 0.01 vs. normal group, *p < 0.05 and **p < 0.01 vs. model group, #p < 0.05 and ##p < 0.01 vs. WSC-H group. C Effects of the RSC and WSC decoctions on the lung histomorphology (red arrows indicate inflammatory infiltration, and black arrows indicate bronchial wall thickening; H&E × 40)