IMAGE

Fig. 5

ID
ZDB-IMAGE-230202-5
Source
Figures for Qu et al., 2023
Image
Figure Caption

Fig. 5

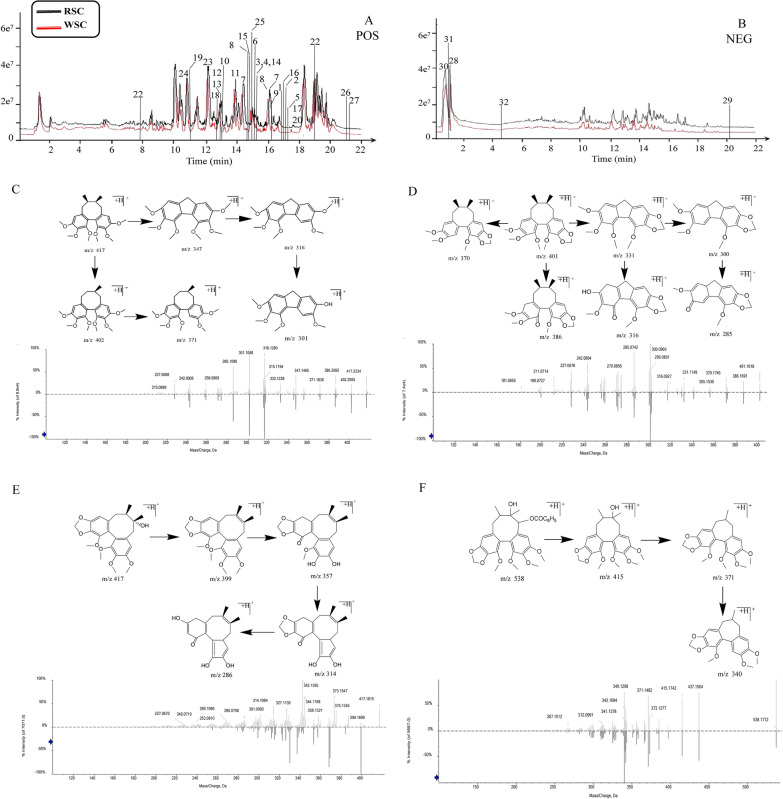
Comparison of chemical profiles of RSC and WSC. A Superposition of the total ion chromatograms of the RSC and WSC decoctions obtained in positive-ion mode, where the ingredients marked in the figure are listed in Table 2. B Superposition of the total ion chromatograms of the RSC and WSC decoctions obtained in negative-ion mode, where the ingredients marked in the figure are listed in Table 2. C The fragmentation pattern and secondary mass spectra of Schisandrin A. D The fragmentation pattern and secondary mass spectra of Schisandrin B. E The fragmentation pattern and secondary mass spectra of Schisandrol B. F The fragmentation pattern and secondary mass spectra of Schisantherin A

Acknowledgments
This image is the copyrighted work of the attributed author or publisher, and ZFIN has permission only to display this image to its users. Additional permissions should be obtained from the applicable author or publisher of the image. Full text @ Chin. Med.