
Image
|
Figure Caption
Fig. 10
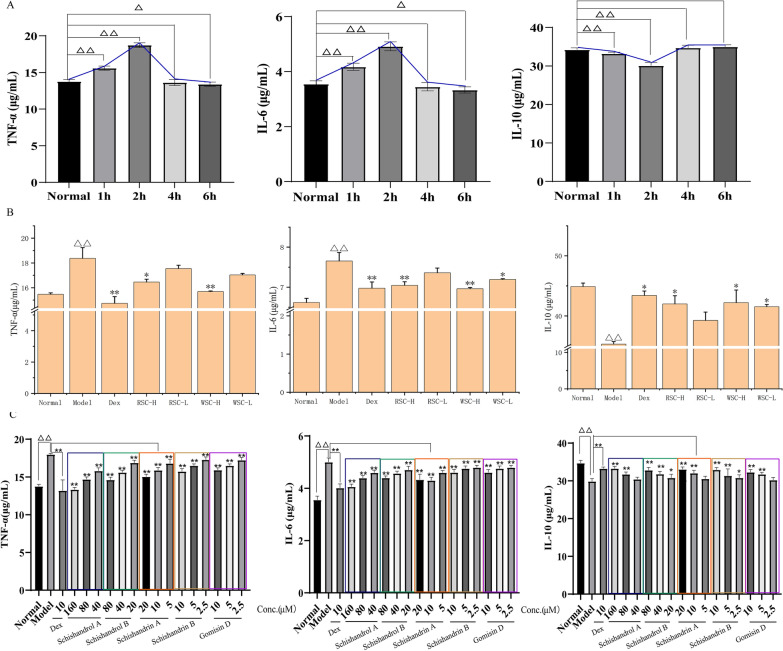
Efficacy validation based on the zebrafish inflammatory model. A Screening of the optimal time points. B Effects of RSC and WSC on the expression of TNF-α, IL-6, and IL-10. C Effects of five Q-markers on the expression of TNF-α, IL-6, and IL-10. The data are expressed as the mean ± SD (n = 10). △p < 0.05 and △△p < 0.01 vs. normal group, *p < 0.05 and **p < 0.01 vs. model group
Acknowledgments
This image is the copyrighted work of the attributed author or publisher, and
ZFIN has permission only to display this image to its users.
Additional permissions should be obtained from the applicable author or publisher of the image.
Full text @ Chin. Med.