
|
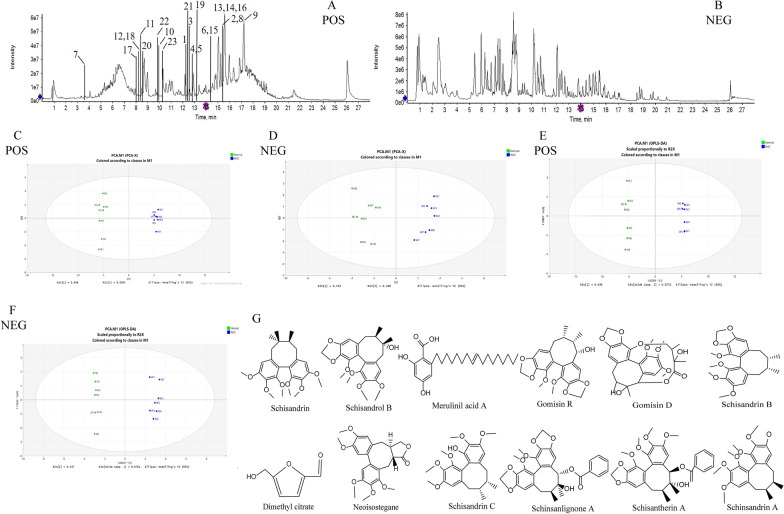
Fig. 3
Identification of pharmacologically active components in the serum of the WSC-H group. A Total ion chromatogram of serum samples from the WSC-H group obtained in positive-ion mode. B Total ion chromatogram of serum samples from the WSC-H group obtained in negative-ion mode. The analysis conditions are detailed in the text, and the compounds labeled in the figure are listed in Table 1. C PCA diagram of the rat serum profile obtained in positive-ion mode. D PCA diagram of the rat serum profile obtained in negative-ion mode. E OPLS-DA diagram of the rat serum profile obtained in positive-ion mode. F OPLS-DA diagram of the rat serum profile obtained in negative-ion mode. G The structural formulas of the potentially bioactive compounds in serum