
- Title
-
Label-free imaging of red blood cells and oxygenation with color third-order sum-frequency generation microscopy
- Authors
- Ortas, J.F., Mahou, P., Escot, S., Stringari, C., David, N.B., Bally-Cuif, L., Dray, N., Négrerie, M., Supatto, W., Beaurepaire, E.
- Source
- Full text @ Light Sci Appl
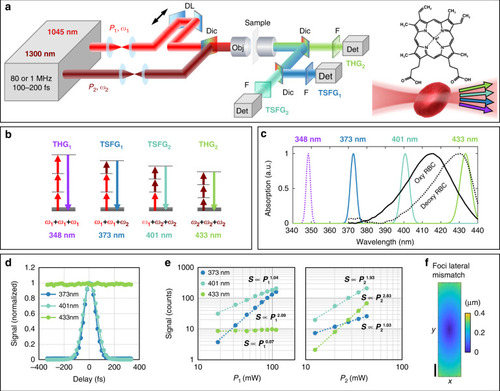
Principles of color TSFG microscopy for blood imaging.
a Experimental setup. DL: motorized optical delay line. Dic: dichroic mirror. Obj: objective lens. F: spectral bandpass filter. Det: detector. b Energy diagram of the simultaneous signals processes in color TSFG microscopy, based on third-order combinations of two excitation beams at frequencies ω1 and ω2. The wavelengths indicated are those produced in the case of mixed 1045 and 1300 nm excitation. c Measured linear absorption spectra of zebrafish RBCs in deoxygenated (dotted line) and oxygenated (solid line) states. The wavelengths generated simultaneously by color TSFG encompass the Soret absorption band of hemoglobin, enabling spectroscopic measurements. d Measured TSFG1, TSFG2 and THG2 signals from a water-glass horizontal interface as a function of the temporal delay between the two excitation pulse trains. e Measured TSFG1, TSFG2 and THG2 signals from polystyrene beads as a function of the excitation power of the pump beam (P1) and OPO beam (P2), consistent with Eq. 1. f Excitation beam foci lateral mismatch along the y-direction, reaching a maximum of 0.4 μm separation 400 µm away from the optical center. Scale bar: 100 μm. The measurement is based on data from 424 fluorescent beads distributed across the field of view |
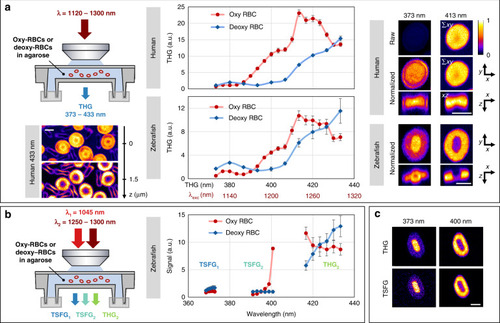
THG and TSFG spectral imaging of red blood cells near the Soret band.
Average THG and TSFG signal from human and zebrafish RBCs in oxygenated and deoxygenated states. 3D images of individual RBCs were recorded at successive excitation wavelengths in the 1120–1300 nm range and normalized by the excitation power and pulse duration. A 10–20× signal enhancement is observed when the emission wavelength matches the Soret band, attributed to three-photon resonance. a Single-beam THG spectra and representative images at 433 nm (left, single planes) and at 373 and 413 nm (right, projections). The spectra were obtained from measurements on N = 7 human and N = 14 zebrafish RBCs. The images are normalized to their maxima except in the first line to illustrate the signal enhancement. The images shown are projections of the central planes along z and y directions. Unlike human RBCs, zebrafish RBCs possess a nucleus where no resonance is observed. b Dual-beam THG-TSFG spectra of zebrafish RBCs acquired by tuning the OPO beam in the range 1250–1300 nm. c Contrast similarity of single-beam THG (top) and TSFG (bottom) images. TSFG images at 373 and 401 nm were acquired simultaneously. Scale bars: 5 μm |
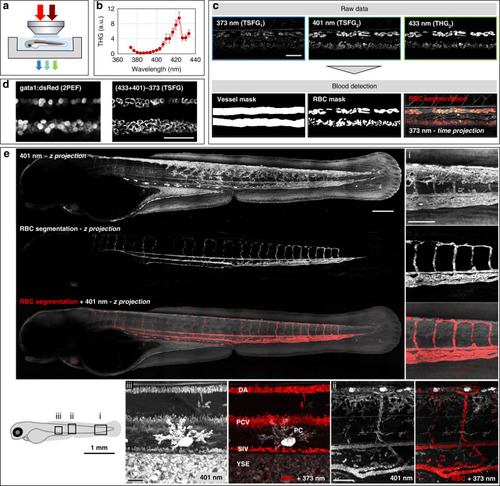
RBC detection in live zebrafish embryos with color TSFG microscopy.
a Experimental scheme. b Average single-beam THG spectrum measured from flowing RBCs in live embryos (N = 3 embryos). c Segmentation of vessels and RBCs from color TSFG images acquired simultaneously at 373, 401 and 433 nm in a region encompassing DA and PCV in 2 dpf embryos. Scale bar: 50 μm. d Simultaneously acquired TSFG and fluorescence images of RBCs in a 2 dpf Tg(gata1a:DsRed) embryo. In this experiment, we induced transient cardioplegia using MS222 to immobilize the RBCs. Scale bar: 50 μm. e TSFG image of an entire embryo recorded in a tile-like fashion over a thickness of 100 µm. Shown are a z-projection of the 401 nm channel revealing blood vessels and other structures, the automated segmentation of the vascular system (see text and methods), and the overlay with the blood shown in red. (i), (ii) and (iii) show zoomed-in details of the tail and trunk, illustrating the effective discrimination provided by color TSFG signals between red blood cells and other structures producing strong signals such as pigmented cells, lipidic structures and other interfaces. DA dorsal aorta, PCV posterior cardinal vein, SIV subintestinal vein, PC pigment cell, YSE yolk sac extension. See also Movies M3–6, and supplementary Figs. S7–S8 |
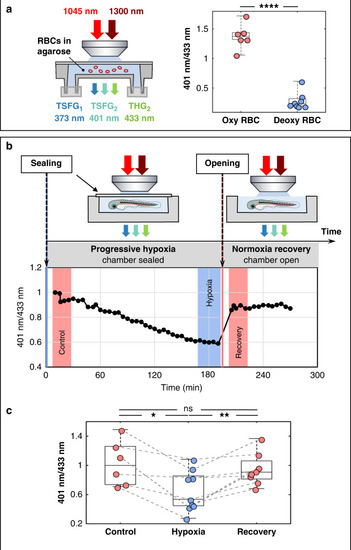
Probing RBC oxygenation state with color TSFG microscopy.
a Experimental setup and measured S401/S433 TSFG signal ratios for isolated zebrafish RBCs in oxygenated (N = 6) and deoxygenated (N = 8) states. p ≤ 0.0001 (unpaired two-tailed Whelch’s test). b Oxygenation dynamics measured on flowing RBCs in a 2 dpf zebrafish. The S401/S433 ratio was measured every 5 min during progressive hypoxia in a sealed chamber and after chamber opening. c Evolution of the S401/S433 ratio during reversible hypoxia experiments for N = 9 different embryos. The values are the average of several points spanning 25 min as in the colored regions shown in the graph in b. The values were normalized by setting the median of the control to 1. One star: p ≤ 0.05; two stars: p ≤ 0.01 (mixed-effects model) |
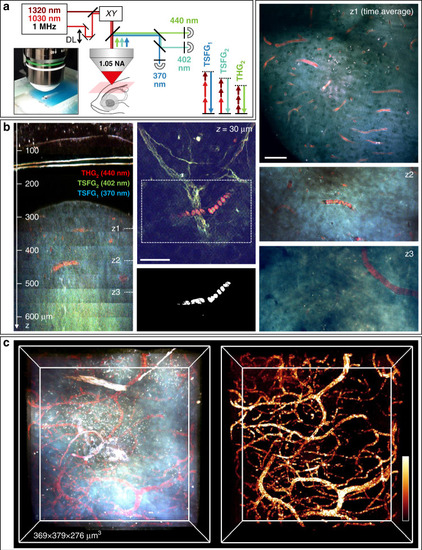
Deep-tissue TSFG imaging in live adult zebrafish brain.
a TSFG microscopy setup scheme for deep tissue imaging with 1 MHz excitation and signal epi-detection. b (left) XZ reslice calculated from a color TSFG z-series spanning >600 μm of imaging depth through the skin, skull and telencephalon of an adult fish. (middle) Sub-skin image showing different spectral signatures for RBCs (in red) and myelinated axons. Segmented RBCs are shown below the image. (Right) Representative images recorded at several depths in the telencephalon, illustrating the specific TSFG contrast of RBCs and vessels. c 3D rendering of the imaged volume in the telencephalon and of the segmented blood vessels. Scale bar: 50 μm. See also Movies M7–10 |