
Fig. 2
- ID
- ZDB-FIG-230131-13
- Publication
- Ortas et al., 2023 - Label-free imaging of red blood cells and oxygenation with color third-order sum-frequency generation microscopy
- Other Figures
- All Figure Page
- Back to All Figure Page
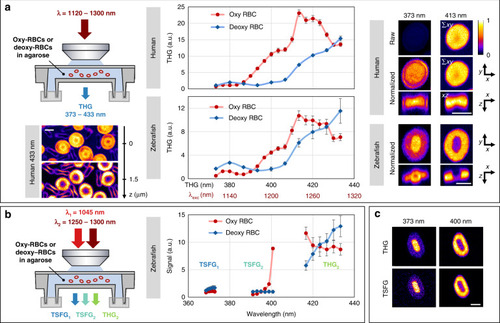
THG and TSFG spectral imaging of red blood cells near the Soret band.
Average THG and TSFG signal from human and zebrafish RBCs in oxygenated and deoxygenated states. 3D images of individual RBCs were recorded at successive excitation wavelengths in the 1120–1300 nm range and normalized by the excitation power and pulse duration. A 10–20× signal enhancement is observed when the emission wavelength matches the Soret band, attributed to three-photon resonance. a Single-beam THG spectra and representative images at 433 nm (left, single planes) and at 373 and 413 nm (right, projections). The spectra were obtained from measurements on N = 7 human and N = 14 zebrafish RBCs. The images are normalized to their maxima except in the first line to illustrate the signal enhancement. The images shown are projections of the central planes along z and y directions. Unlike human RBCs, zebrafish RBCs possess a nucleus where no resonance is observed. b Dual-beam THG-TSFG spectra of zebrafish RBCs acquired by tuning the OPO beam in the range 1250–1300 nm. c Contrast similarity of single-beam THG (top) and TSFG (bottom) images. TSFG images at 373 and 401 nm were acquired simultaneously. Scale bars: 5 μm |