
|
Fig. 4
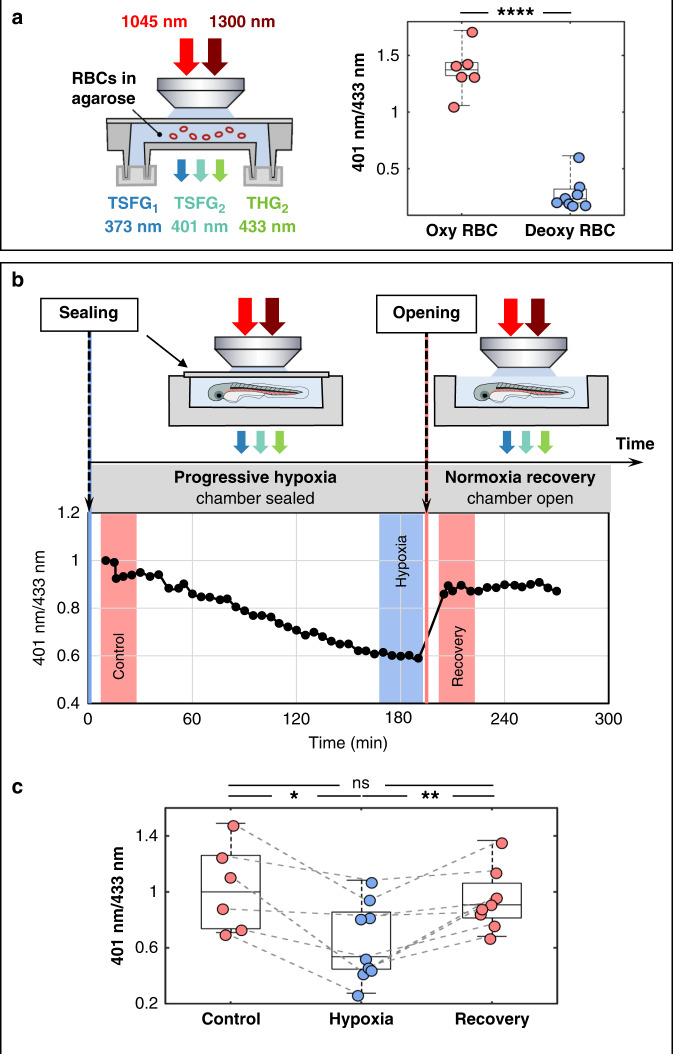
a Experimental setup and measured S401/S433 TSFG signal ratios for isolated zebrafish RBCs in oxygenated (N = 6) and deoxygenated (N = 8) states. p ≤ 0.0001 (unpaired two-tailed Whelch’s test). b Oxygenation dynamics measured on flowing RBCs in a 2 dpf zebrafish. The S401/S433 ratio was measured every 5 min during progressive hypoxia in a sealed chamber and after chamber opening. c Evolution of the S401/S433 ratio during reversible hypoxia experiments for N = 9 different embryos. The values are the average of several points spanning 25 min as in the colored regions shown in the graph in b. The values were normalized by setting the median of the control to 1. One star: p ≤ 0.05; two stars: p ≤ 0.01 (mixed-effects model)